3 TensorFlow原理与进阶
文章目录
- 从HelloWorld开始
- TensorFlow的编程模式
- TensorFlow的基础结构
- 图和会话
- Python常用库Numpy的使用
- 什么是Tensor
- 几种Tensor
- 图和会话原理及案例
- 可视化利器TensorBoard
- TensorBoard实例
- 酷炫模拟游乐园PlayGround
- 常用python库Matplotlib
从HelloWorld开始
# -*- coding: UTF-8 -*-

# 引入 TensorFlow 库
import tensorflow as tf

# 创建一个 Constant(常量)Operation(操作)
hw = tf.constant("Hello World! I love TensorFlow!")  # 我爱 TensorFlow

# 启动一个 TensorFlow 的 Session(会话)
sess = tf.Session()

# 运行 Graph(计算图)
print sess.run(hw)

# 关闭 Session(会话)
sess.close()
运行结果是
![]()
如果介意上面的输入日志内容
代码开头前加上
import os
os.environ[‘TF_CPP_MIN_LOG_LEVEL’] = '2’
即可
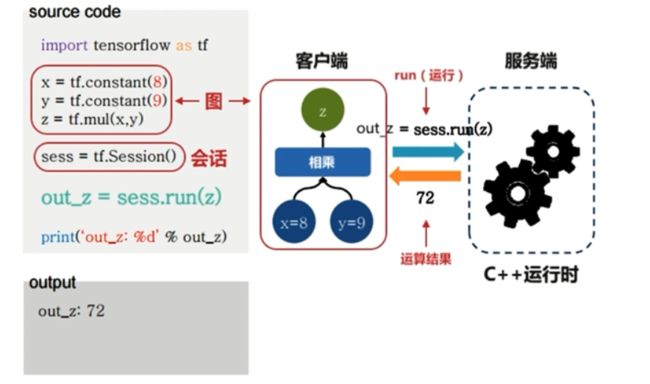
TensorFlow的编程模式
机器学习一般的两种编程模式
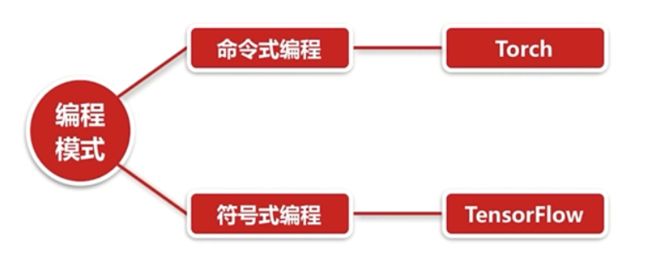
命令式编程
容易理解,命令语句基本没优化: C, Java , C++ , Python
符号式编程
涉及较多的嵌入和优化,运行速度有同比提升
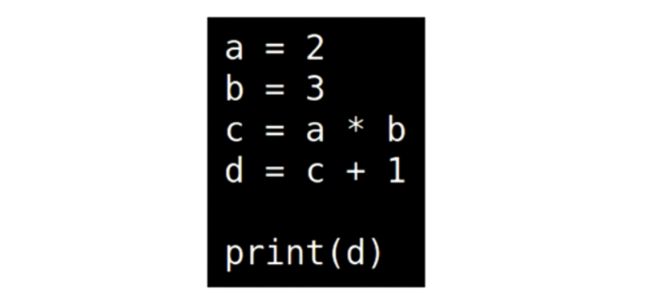
命令式编程demo
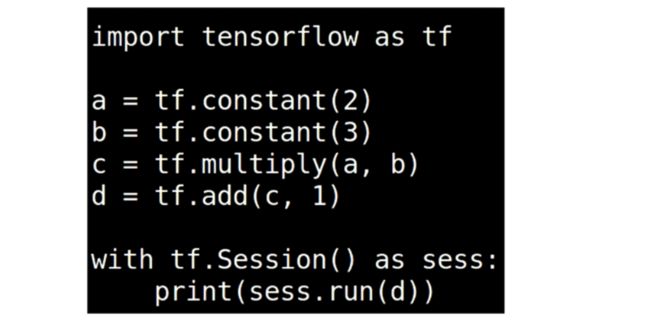
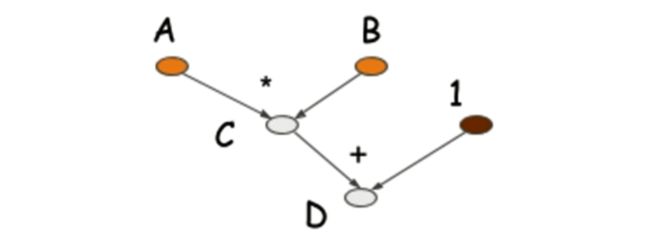
符号式编程流图
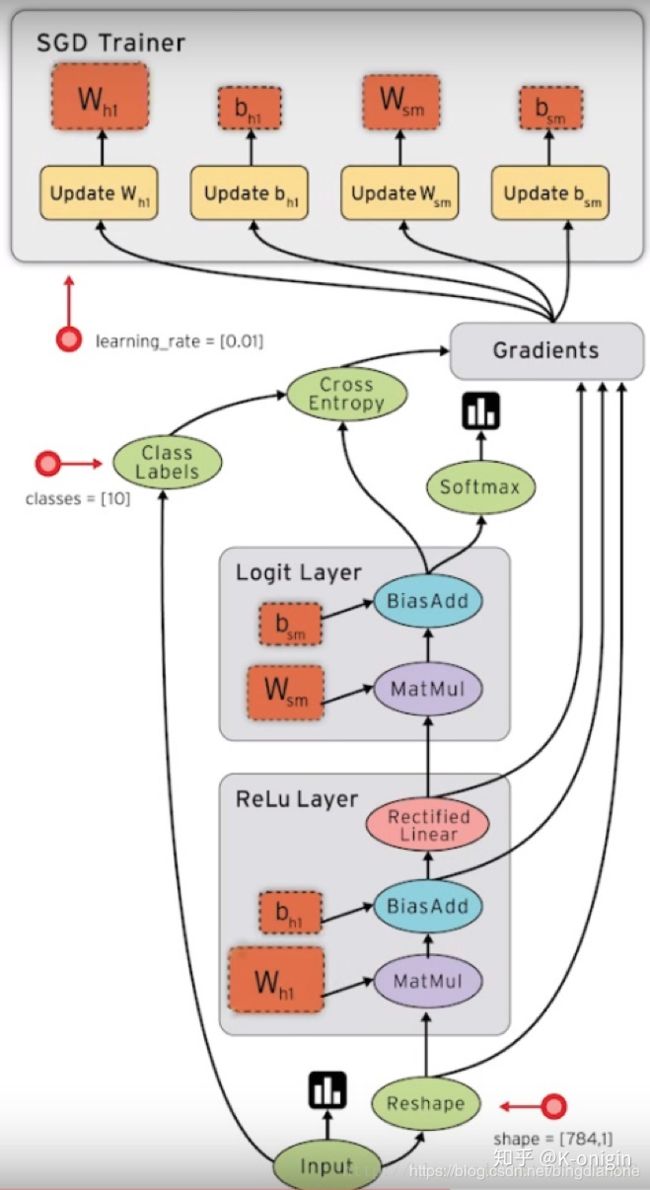
TensorFlow的基础结构
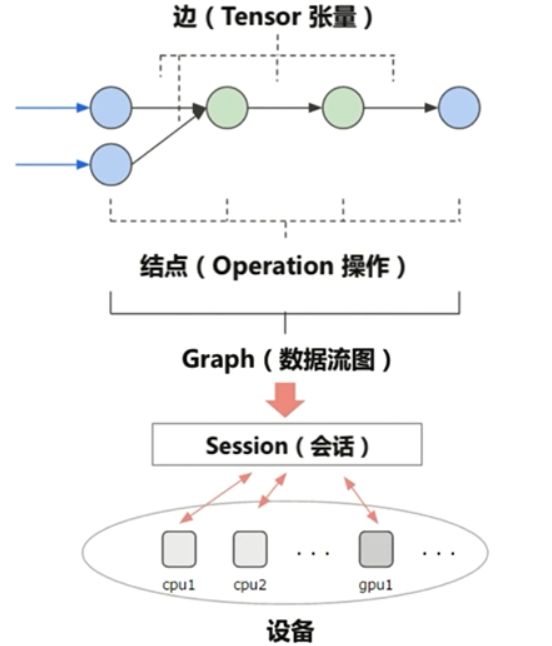
边就是流动的Tensor;节点就是一些Operation,数学操作和一些函数之类的,节点的输入和输出都是Tensor;边和节点共同构成了TensorGraph 数据流图。数据流图需要有session才可以运行;session可以在不同的设备上去运行,比如cpu和gpu。
图的基本构成

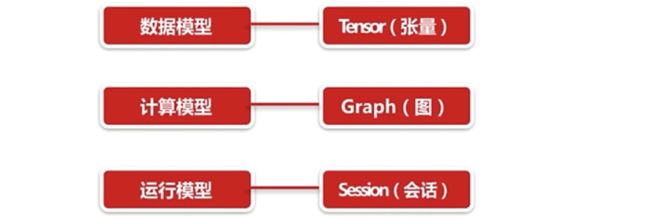
TensorFlow 的基础模型
图和会话
数据流图(DataFlowGraph) 张量流图

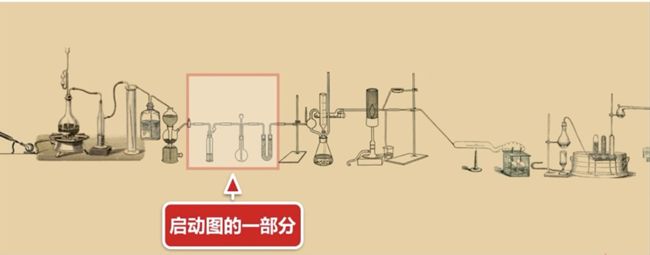
Graph(图)的形象比喻

图中的仪器就像各个节点,这些节点里面进行一些操作;导管之间链接的部位,流动的被实验的东西就像张量,实验的一个对象就可以看作张量
什么是会话(Session)
构建一个图,然后创建一个会话,用这个会话去运行这个图的某一部分结果
或者是整个图的结果。
Session的作用
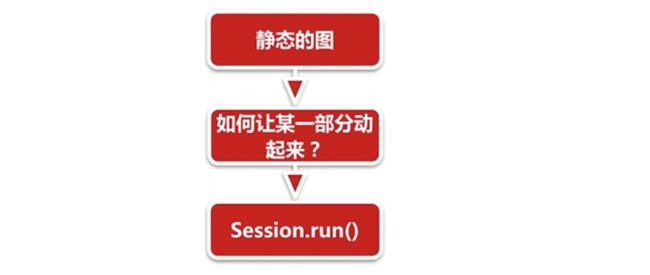
Session.run()的形象比喻
比如说某一部分,如何让图中的一部分实验仪器发生一些化学反应,就可以Session.run()一下启动图的一部分,让烧杯加一点试剂或者给试管加热,session就是用来启动图的会话作用。
TensorFlow程序的流程
1.定义算法的 计算图(Graph ) 结构
2,使用 会话(Session ) 执行计算
Python常用库Numpy的使用
numpy的官网:
http://www.numpy.org/
TensorFlow和Numpy有一定的联系
- 有很多类似的概念和API
- Numpy是python里的一个与科学计算相关的项目
练习numpy
在python命令行shell环境执行的
>>> import numpy as np
>>> vector = np.array([1,2,3])
>>> vector.shape  ##shape是形状;指的是在一条直线上的3个数
(3,)
>>> vector.ndim   ##维度是1即阶数是1
1
>>> type(vector)  ##输出vector的类型
<type 'numpy.ndarray'>
>>> matrix = np.array([[1,2],[3,4]])  == 二维数组
>>> matrix.shape  ##输出形状是2*2的一个数组
(2, 2)
>>> matrix.ndim
2
>>> matrix.size
4
>>> type(vector)  ##输出vector的类型
<type 'numpy.ndarray'>
>>> one = np.arange(12)
>>> one
array([ 0,  1,  2,  3,  4,  5,  6,  7,  8,  9, 10, 11])
>>> one.reshape((3,4))  ##将一维改为三行四列的二维矩阵
array([[ 0,  1,  2,  3],
       [ 4,  5,  6,  7],
       [ 8,  9, 10, 11]])
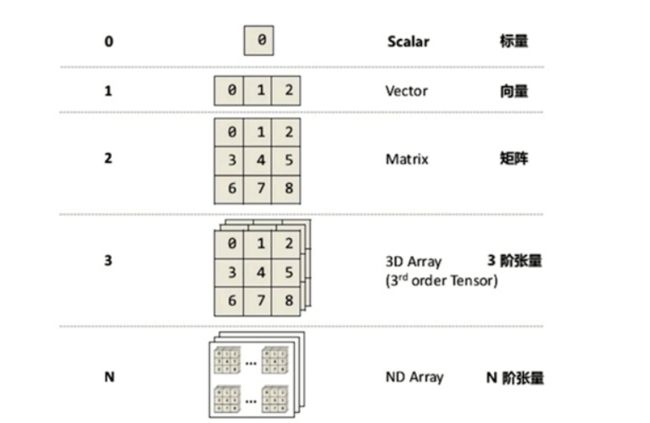
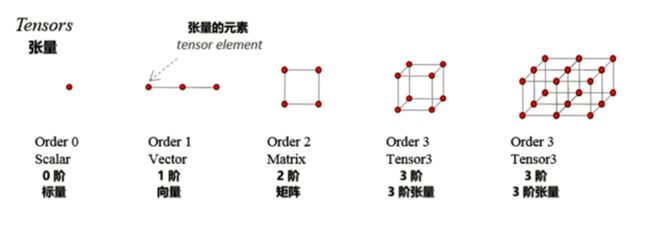
什么是Tensor
什么是(Tensor)张量
数据流图(DataFlowGraph) 张量流图
张量的维度(秩):Rank/Order
>>> zeros = np.zeros((3,4))  ## 全零得矩阵
>>> zeros
array([[0., 0., 0., 0.],
       [0., 0., 0., 0.],
       [0., 0., 0., 0.]])
>>> ones = np.ones((5,6))  ##五行六列得矩阵
>>> ones
array([[1., 1., 1., 1., 1., 1.],
       [1., 1., 1., 1., 1., 1.],
       [1., 1., 1., 1., 1., 1.],
       [1., 1., 1., 1., 1., 1.],
       [1., 1., 1., 1., 1., 1.]])
>>> ident = np.eye(4) ##对角线矩阵
>>> ident
array([[1., 0., 0., 0.],
       [0., 1., 0., 0.],
       [0., 0., 1., 0.],
       [0., 0., 0., 1.]])
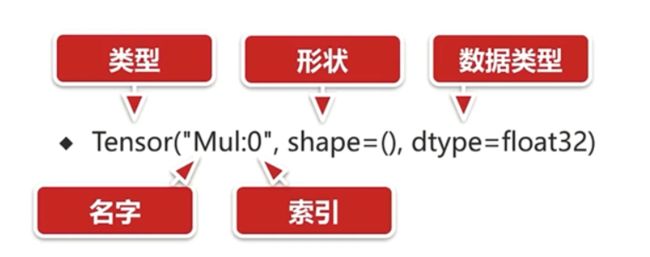
Tensor的属性

几种Tensor
Constant(常量)
- 值不能改变的一种Tensor
>>> import tensorflow as tf
>>> const = tf.constant(3)
>>> const
<tf.Tensor 'Const:0' shape=() dtype=int32> # 结构明显和python不同;只有创建了会话才可以输出值
>>> a = 3 #python是直接输出值
>>> a
3
>>>
Variable(变量)
- 值可以改变的一种Tensor
>>> var = tf.Variable(3)
>>> var
<tf.Variable 'Variable:0' shape=() dtype=int32_ref>
>>> var1 = tf.Variable(4, dtype=tf.int64) #指定dtype
>>> var1
<tf.Variable 'Variable_1:0' shape=() dtype=int64_ref>
Placeholder(占位符)
- 先占住一个固定的位置,等着你之后往里面添加值得一种Tensor
SparseTensor(稀疏张量)
- 一种“稀疏”得Tensor,类似线性代数里得稀疏矩阵的概念
Tensor表示法
- Tensor(“Mul:0”,shape=() dtype=float32>)
图和会话原理及案例
TensorFlow程序得流程
- 定义算法得 计算图 (Graph)结构
- 使用 会话(Session)执行图得一部分(计算)
graph_session.py
# -*- coding: UTF-8 -*-

# 引入 TensorFlow
import tensorflow as tf

# 创建两个常量 Tensor
const1 = tf.constant([[2, 2]])
const2 = tf.constant([[4],
                      [4]])

# 张量相乘(multiply 是 相乘 的意思)
multiply = tf.matmul(const1, const2)

# 尝试用 print 输出 multiply 的值
print("sess.run() 之前,尝试输出 multiply 的值: {}".format(multiply))

# 创建了 Session(会话)对象
sess = tf.Session()

# 用 Session 的 run 方法来实际运行 multiply 这个
# 矩阵乘法操作,并把操作执行的结果赋值给 result
result = sess.run(multiply)
# 用 print 打印矩阵乘法的结果
print("sess.run() 之后,输出 multiply 的值: {}".format(result))

if const1.graph is tf.get_default_graph():
    print("const1 所在的图(Graph)是当前上下文默认的图")

# 关闭已用完的 Session(会话)
sess.close()

# 第二种方法来创建和关闭 Session
# 用了 Python 的上下文管理器(with ... as ... :)
with tf.Session() as sess:
    result2 = sess.run(multiply)
    print("multiply 的结果是 {} ".format(result2))
可视化利器TensorBoard
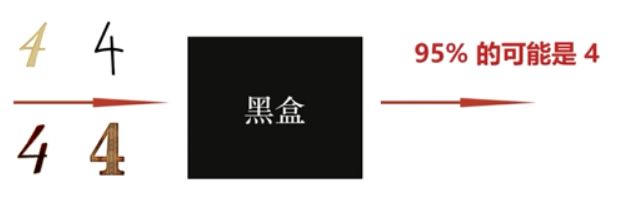
人工智能的黑盒

比如
- 用TensorFlow保存图的信息到日志中
tf.summary.FileWriter("日志保存的路径",sess.graph)
- 用TensorBoard读取并展示日志
tensorboard --logdir = 日志所在路径
summary(总结、概览)
- 用于导出关于模型的精简信息的方法
- 可以使用TensorBoard等工具访问这些信息
name_scope(命名空间)
- 很像一些编程语言(如C++ )的namespace,包含/嵌套的关系
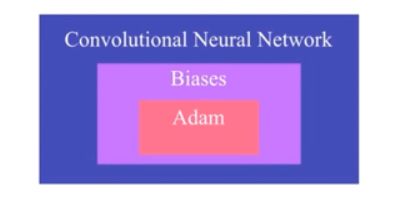
一个节点包着一个节点
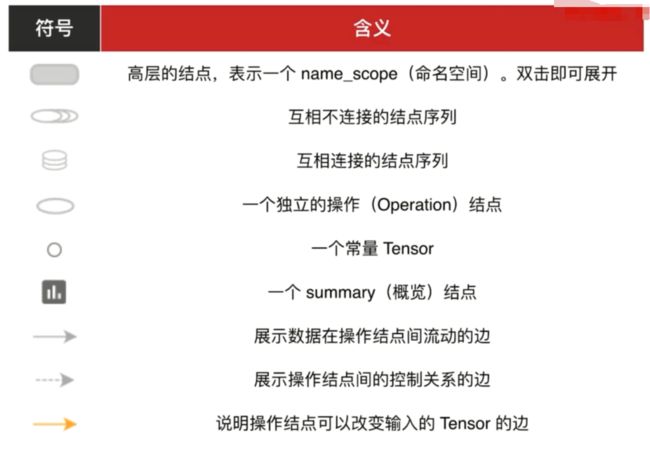
符号含义
TensorBoard实例
# -*- coding: UTF-8 -*-
# 引入tensorflow
import tensorflow as tf
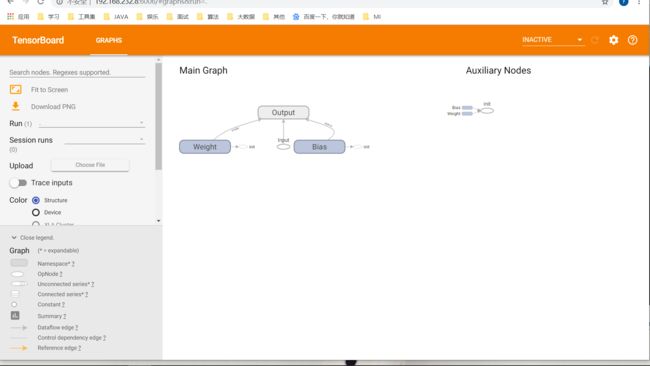
# 构造图(Graph)的结构
# 用一个线性方程的例子 y = W * x + b
W = tf.Variable(2.0, dtype=tf.float32, name="Weight") # 权重
b = tf.Variable(1.0, dtype=tf.float32, name="Bias") # 偏差
x = tf.placeholder(dtype=tf.float32, name="Input") # 输入
with tf.name_scope("Output"): # 输出的命名空间
y = W * x + b # 输出
# const = tf.constant(2.0) # 不需要初始化
# 定义保存日志的路径
path = "./log"
# 创建用于初始化所有变量(Variable)的操作
# 如果定义了变量,但没有初始化的操作,会报错
init = tf.global_variables_initializer()
# 创建 Session(会话)
with tf.Session() as sess:
sess.run(init) # 初始化变量
writer = tf.summary.FileWriter(path, sess.graph)
result = sess.run(y, {x: 3.0}) # 为 x 赋值 3
print("y = W * x + b,值为 {}".format(result)) # 打印 y = W * x + b 的值,就是 7
直接python运行程序会出现结果并生成一个log文件夹
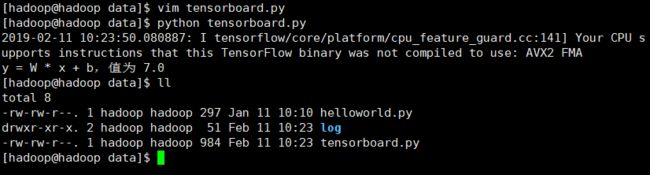
运行Tensorboard
![]()
酷炫模拟游乐园PlayGround
游乐场简介
- JavaScript编写的网页应用
- 通过浏览器就可以训练简单神经网络
- 训练过程可视化,高度可定制
- http://playground.tensorflow.org
常用python库Matplotlib
Matplotlib
- 一个极其强大的Python绘图库。官网: matplotlib.org
- 很少的代码即可绘制2D/3D ,静态/动态等各种图形
- 一般常用的是它的子包: PyPlot,提供类似MATLAB的绘图框架
Matplotlib一般绘图流程
直接使用 pip install matplotlib 安装绘图库
# -*- coding: UTF-8 -*-

# 引入 Matplotlib 的分模块 pyplot
import matplotlib.pyplot as plt
# 引入 numpy
import numpy as np

# 创建数据
x = np.linspace(-2, 2, 100)
# y = 3 * x + 4
y1 = 3 * x + 4
y2 = x ** 3

# 创建图像
# plt.plot(x, y)
plt.plot(x, y1)
plt.plot(x, y2)

# 显示图像
plt.show()
# -*- coding: UTF-8 -*-

import matplotlib.pyplot as plt
import numpy as np

# 创建数据
x = np.linspace(-4, 4, 50)
y1 = 3 * x + 2
y2 = x ** 2

# 第一张图
plt.figure(num=1, figsize=(7, 6))
plt.plot(x, y1)
plt.plot(x, y2, color="red", linewidth=3.0, linestyle="--")

# 第二张图
plt.figure(num=2)
plt.plot(x, y2, color="green")

# 显示所有图像
plt.show()