python实现最小二乘法回归模拟及绘图
目录
准备工作
回归计算
模拟结果检测
均方差检验
有噪声数据回归
多维回归
准备工作
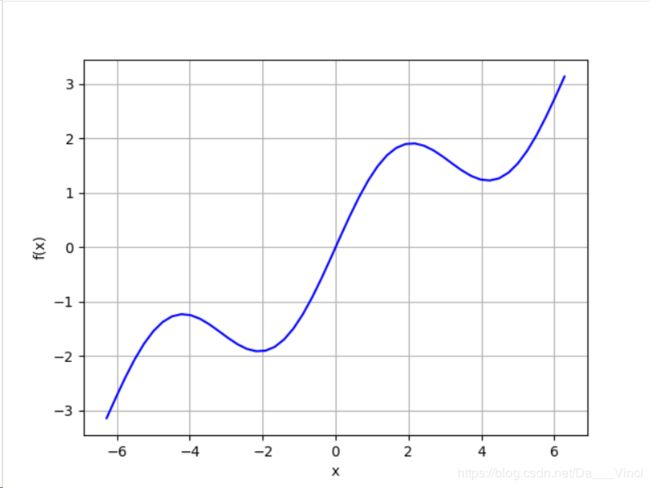
首先通过linspace函数生成固定区间,然后定义一个函数,有三角函数和线性函数组成
import numpy as np
import matplotlib.pyplot as plt

def f(x):
    return np.sin(x) + 0.5*x
x = np.linspace(-2*np.pi,2*np.pi,50)
plt.plot(x,f(x),'b')
plt.grid(True)
plt.xlabel('x')
plt.ylabel('f(x)')
plt.show()
回归计算
回归是相当高效的函数近似值计算工具,根据给定的样本点,模拟出样本的函数关系世。在多纬度同样有效,执行迅速。
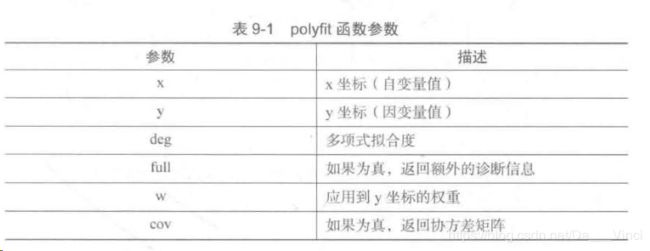
Numpy使用polyfit和polyval函数进行回归计算
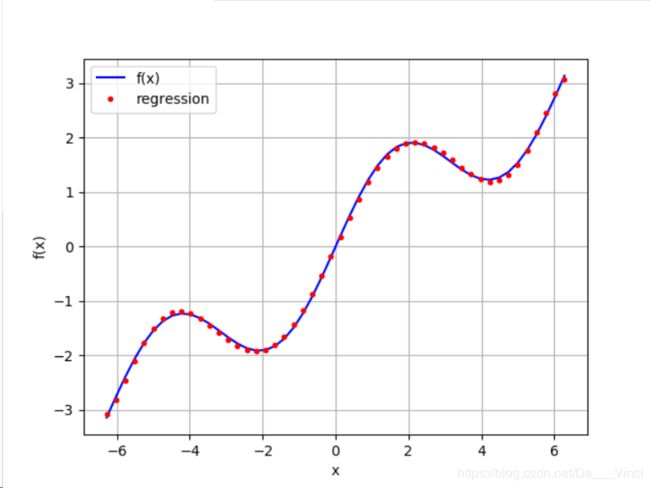
对于上述福 f(x) 函数,一维回归过程如下:
import numpy as np
import matplotlib.pyplot as plt

def f(x):
    return np.sin(x) + 0.5*x
x = np.linspace(-2*np.pi,2*np.pi,50)

reg = np.polyfit(x,f(x),deg=1) #输入训练样本  设置一元
ry = np.polyval(reg,x)
plt.plot(x,f(x),'b',label='f(x)')
plt.plot(x,ry,'r.',label='regression')
plt.legend(loc=0) #左上角显示label
plt.grid(True)
plt.xlabel('x')
plt.ylabel('f(x)')
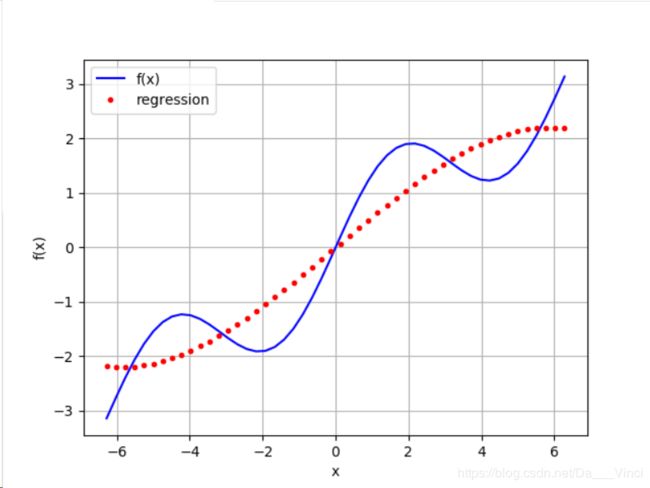
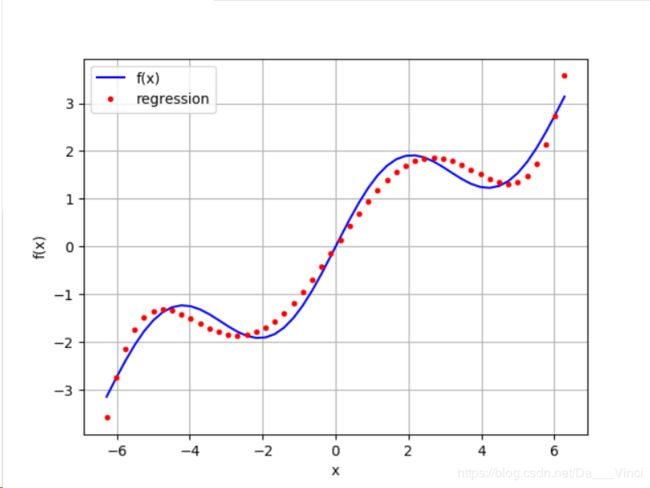
plt.show()修改reg的参数deg,以不同元进行回归模拟
deg = 3
deg = 5
deg = 7
多项式的次幂越高。模拟越相似
模拟结果检测
print(np.allclose(f(x),ry))

OutPut:False
均方差检验
print(np.sum((f(x)-ry)**2)/len(x))

OutPut:0.00177691347595176
有噪声数据回归
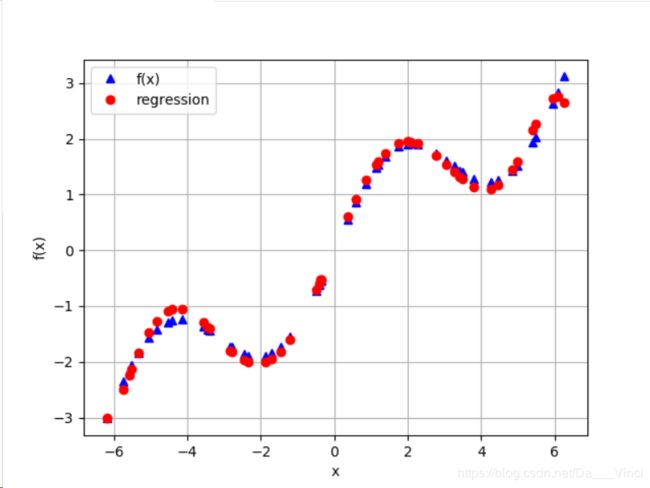
回归对于有噪声数据同样能够很好的处理,这种数据来自模拟的测量或者不完善的数据。回归的结果比有噪声的数据点更接近原始数据,在某种意义上,回归在一定程度平均了噪声。
import numpy as np
import matplotlib.pyplot as plt

def f(x):
    return np.sin(x) + 0.5*x
x = np.linspace(-2*np.pi,2*np.pi,50)
x = np.linspace(-2*np.pi,2*np.pi,50) + 0.15*np.random.standard_normal((len(x)))
y = f(x) + 0.25*np.random.standard_normal(len(x))

reg = np.polyfit(x,y,deg=7) #输入训练样本  设置一元
ry = np.polyval(reg,x)

plt.plot(x,f(x),'b^',label='f(x)')
plt.plot(x,ry,'ro',label='regression')
plt.legend(loc=0) #左上角显示label
plt.grid(True)
plt.xlabel('x')
plt.ylabel('f(x)')
plt.show()
延伸:同有噪声数据一样,回归方法不关心观测点的顺序,可以进行无缝处理。
多维回归
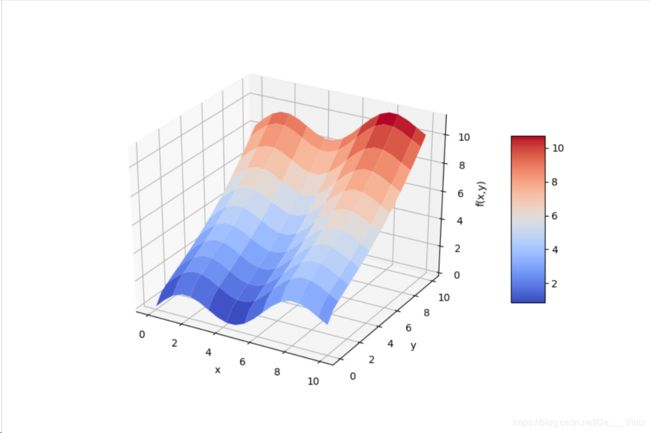
如下生成一个多维样本,并显示了f(x)函数的形状。
#coding:UTF-8
from mpl_toolkits.mplot3d import Axes3D
import matplotlib as mpl
import numpy as np
import matplotlib.pyplot as plt

def f(*args):
    return np.sin(args[0]) + 0.25*args[0] + np.sqrt(args[1]) + 0.05*args[1]**2
x = np.linspace(0,10,20)
y = np.linspace(0,10,20)
X, Y = np.meshgrid(x,y)
Z = f(X, Y)
x = X.flatten()
y = Y.flatten()

fig = plt.figure(figsize=(9,6))
ax = fig.gca(projection = '3d')
surf  =ax.plot_surface(X,Y,Z,rstride=2,cstride=2,cmap=mpl.cm.coolwarm,linewidth = 0.5,antialiased=True)
ax.set_xlabel('x')
ax.set_ylabel('y')
ax.set_zlabel('f(x,y)')
fig.colorbar(surf,shrink=0.5,aspect=5)
plt.show()
为了获得良好的回归结果,我们为基函数添加如上函数的因子,包含sin和sqrt。
matrix = np.zeros((len(x),6+1))
matrix[:,6] = np.sqrt(y)
matrix[:,5] = np.sin(x)
matrix[:,4] = y**2
matrix[:,3] = x**2
matrix[:,2] = y
matrix[:,1] = x
matrix[:,0] = 1
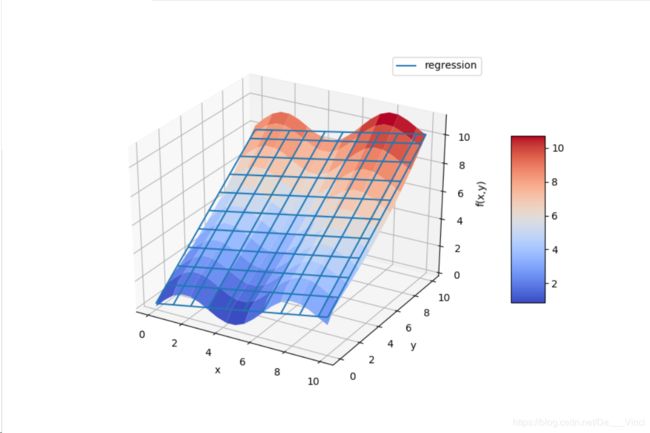
我们呢使用statsmodels函数进行多维最小二乘回归。完整过程如下:
#coding:UTF-8
from mpl_toolkits.mplot3d import Axes3D
import matplotlib as mpl
import numpy as np
import matplotlib.pyplot as plt
import statsmodels.api as sm

def f(*args):
    return np.sin(args[0]) + 0.25*args[0] + np.sqrt(args[1]) + 0.05*args[1]**2
x = np.linspace(0,10,20)
y = np.linspace(0,10,20)
X, Y = np.meshgrid(x,y)
Z = f(X, Y)
x = X.flatten()
y = Y.flatten()

matrix = np.zeros((len(x),6+1))
matrix[:,6] = np.sqrt(y)
matrix[:,5] = np.sin(x)
matrix[:,4] = y**2
matrix[:,3] = x**2
matrix[:,2] = y
matrix[:,1] = x
matrix[:,0] = 1

model = sm.OLS(f(x,y),matrix).fit()
a = model.params
print(a)
def reg_func(a,*args):
    f6 = a[6]*np.sqrt(args[1])
    f5 = a[5]*np.sin(args[0])
    f4 = a[4]*args[1]**2
    f3 = a[3]*args[0]**2
    f2 = a[2]*args[1]
    f1 = a[1]*args[0]
    f0 = a[0]*1
    return (f6 + f5 + f4 + f3 + f2 + f1 + f0)

RZ = reg_func(a,X,Y)
fig = plt.figure(figsize=(9,6))
ax = fig.gca(projection = '3d')

surf1  =ax.plot_surface(X,Y,Z,rstride=2,cstride=2,cmap=mpl.cm.coolwarm,linewidth = 0.5,antialiased=True)
surf2 =ax.plot_wireframe(X,Y,RZ,rstride=2,cstride=2,label='regression')


ax.set_xlabel('x')
ax.set_ylabel('y')
ax.set_zlabel('f(x,y)')
ax.legend()
fig.colorbar(surf1,shrink=0.5,aspect=5)
plt.show()
如果基函数元素较少,回归效果会简单一些
matrix = np.zeros((len(x),6+1))
matrix[:,2] = y
matrix[:,1] = x
matrix[:,0] = 1