记录笔记,请多指教
学习网址推荐
酷炫canvas动画网址推荐
公司用的图表ECharts
HTML5 < canvas > 标签是一个用来展示绘图效果的标签,它和< img >类似,都是行内块元素
不过< canvas > 元素本身并没有绘制能力,它仅仅是图形的容器,或者是画板,用来展示绘图效果的
需要通过 getContext() 方法来打开canvas,然后在上面用JS来完成实际的绘图
以下是基础用法:
1.最简单的画一个正方形
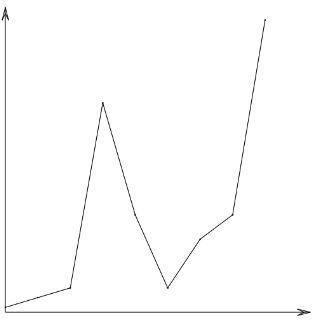
2.等比缩放折线图
.html文件:
line.js文件:
/*
 *  line  折线图构造函数
 *  ctx: Context 绘图环境
 *  data: Array 绘制折线图所需的数据
 *  padding: Object 设置坐标轴到画布的边距
 *  arrow: Object 设置箭头的宽高
 * */
function Line( ctx, data, padding, arrow ) {

    this.ctx = ctx;
    this.data = data;
    this.padding = padding || { top: 10, right: 10, bottom: 10, left: 10 };
    this.arrow = arrow || { width: 10, height: 20 };

    // 上顶点的坐标
    this.vertexTop = {
        x: this.padding.left,
        y: this.padding.top
    }

    // 原点的坐标
    this.origin = {
        x: this.padding.left,
        y: this.ctx.canvas.height - this.padding.bottom
    }

    // 右顶点的坐标
    this.vertexRight = {
        x: this.ctx.canvas.width - this.padding.right,
        y: this.ctx.canvas.height - this.padding.bottom
    }

    // 计算坐标轴表示的最大刻度
    this.coordWidth = this.ctx.canvas.width - this.padding.left - this.padding.right - this.arrow.height;
    this.coordHeight = this.ctx.canvas.height - this.padding.top - this.padding.bottom - this.arrow.height;

}

// 给原型扩充方法
Line.prototype = {
    constructor: Line,

    draw: function() {
        this.drawCoord();
        this.drawArrow();
        this.drawLine();
    },

    // 绘制坐标轴
    drawCoord: function() {
        this.ctx.beginPath();
        this.ctx.moveTo( this.vertexTop.x, this.vertexTop.y );
        this.ctx.lineTo( this.origin.x, this.origin.y );
        this.ctx.lineTo( this.vertexRight.x, this.vertexRight.y );
        this.ctx.stroke();
    },

    // 绘制建箭头
    drawArrow: function() {

        // 上箭头
        this.ctx.beginPath();
        this.ctx.moveTo( this.vertexTop.x, this.vertexTop.y );
        this.ctx.lineTo( this.vertexTop.x - this.arrow.width / 2, this.vertexTop.y + this.arrow.height );
        this.ctx.lineTo( this.vertexTop.x, this.vertexTop.y + this.arrow.height / 2 );
        this.ctx.lineTo( this.vertexTop.x + this.arrow.width / 2, this.vertexTop.y + this.arrow.height );
        this.ctx.closePath();
        this.ctx.stroke();

        // 右箭头
        this.ctx.beginPath();
        this.ctx.moveTo( this.vertexRight.x, this.vertexRight.y );
        this.ctx.lineTo( this.vertexRight.x - this.arrow.height, this.vertexRight.y - this.arrow.width / 2 );
        this.ctx.lineTo( this.vertexRight.x - this.arrow.height / 2, this.vertexRight.y );
        this.ctx.lineTo( this.vertexRight.x - this.arrow.height, this.vertexRight.y + this.arrow.width / 2 );
        this.ctx.closePath();
        this.ctx.stroke();
    },

    // 根据数据绘制折线图
    drawLine: function() {

        // 先清除之前的路径
        this.ctx.beginPath();

        // 保存当前的this
        var self = this;

        /*
         * 计算x和y轴坐标的缩放比值:
         * ratioX = this.coordWidth / this.data.length
         * ratioY = this.coordHeight / Math.max.apply( this.data )
         * */

        var ratioX = this.coordWidth / this.data.length,
            ratioY = this.coordHeight / Math.max.apply( null, this.data );

        /*
         * 要根据原点的坐标来计算点的坐标
         * x = self.origin.x + x
         * y = self.origin.y - y
         * */

        // 遍历所有的数据,依次绘制点
        this.data.forEach( function( y, x ) {
            self.ctx.fillRect( self.origin.x + ( x * ratioX ) - 1, self.origin.y - ( y * ratioY ) - 1 , 2, 2 );
        });

        // 遍历所有的数据,依次绘制线
        this.data.forEach( function( y, x ) {
            self.ctx.lineTo( self.origin.x + ( x * ratioX ), self.origin.y - ( y * ratioY ) );
        });

        // 绘制线
        this.ctx.stroke();
    }
}
3.最简单的画弧或圆
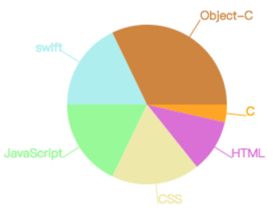
4.基本的饼图
.html文件:
drawBing.js文件
(function( w ) {

    // 把角度转换为弧度
    function angleToRadian( angle ) {
        return Math.PI / 180 * angle;
    }

    // 混入式继承
    function extend( o1, o2 ) {
        for ( var key in o2 ) {
            // 只有o2自己的属性才会copy到o1身上
            if ( o2.hasOwnProperty( key ) ) {
                o1[ key ] = o2[ key ];
            }
        }
    }

    /*
     * bing 饼图构造函数
     * x: number 圆心x轴坐标
     * y: number 圆心y轴坐标
     * r: number 圆半径
     * data: Array 绘制饼图所需的数据
     * */
    function bing( x, y, r, data ) {

        this.x = x;
        this.y = y;
        this.r = r;
        this.data = data;

        // 一组颜色
        this.colors = [ 'orange', 'orchid', 'palegoldenrod', 'palegreen', 'paleturquoise', 'peru', 'pink' ];
    }

    // 给原型扩充方法
    extend( bing.prototype, {

        // 绘制饼图
        draw: function() {

            // 在外面保存一下this
            var self = this;

            // 数据的总和
            var num = 0;
            this.data.forEach( function( obj ) {
                num += obj.val;
            });

            // 一个数据值所占用的角度
            var baseAngle = 360 / num;

            // 假设一开始就绘制了一个起始为0,结束为0的扇形
            var startAngle = 0,
                endAngle = 0,
                lineAngle = 0,
                lineX, lineY;

            // 画扇形
            this.data.forEach( function( obj, i ) {

                // 每次进来,计算当前扇形的起始角度和结束角度

                // 下一个扇形的起始角度,是当前扇形的结束角度
                startAngle = endAngle;
                // 这个结束角度 = 上一个扇形的结束角度 + 当前数值所对应的角度
                endAngle = endAngle + baseAngle * obj.val;

                // 求扇形中间线的角度
                lineAngle = startAngle + baseAngle * obj.val / 2;
                /*
                * 根据中间线的角度,求中间的线的x和y坐标:
                * x = 圆心x + r * Math.cos( angleToRadian( pointAngle ) )
                * y = 圆心y + r * Math.sin( angleToRadian( pointAngle ) )
                * */
                lineX = self.x + ( self.r + 20 ) * Math.cos( angleToRadian( lineAngle ) );
                lineY = self.y + ( self.r + 20 ) * Math.sin( angleToRadian( lineAngle ) );


                // 画每一个扇形
                ctx.beginPath();
                ctx.moveTo( self.x, self.y );
                ctx.arc( self.x, self.y, self.r, angleToRadian( startAngle ), angleToRadian( endAngle ) );
                ctx.closePath();
                ctx.fillStyle = self.colors[ i ];
                ctx.fill();

                // 画每一个扇形的平分线
                ctx.beginPath();
                ctx.moveTo( self.x, self.y );
                ctx.lineTo( lineX, lineY );
                ctx.strokeStyle = self.colors[ i ];
                ctx.stroke();

                // 绘制文字
                if ( lineAngle >= 90 && lineAngle <= 270 ) {
                    ctx.textAlign = 'right';
                }else {
                    ctx.textAlign = 'left';
                }
                ctx.fillText( obj.msg, lineX, lineY );
            });
        }
    } );

    // 把构造函数暴露到全局
    w.bing = bing;

}( window ));
5.绘制图像是绘制动画的基础
6.帧动画
有了绘制图像的基础,加个定时器,拿一张精灵图不停地重绘就可以实现帧动画了
7.平移.旋转.缩放
旋转.平移.缩放加上帧动画,就是制作动画的基础了


