原文:http://ryanipete.com/blog/ios/swift/objective-c/uidebugginginformationoverlay/
翻译不准确的地方可以随时联系我做修改,转载请注明来源
While browsing UIKit’s private headers recently, I came across a class that I hadn’t seen before - UIDebuggingInformationOverlay. A Google search didn’t turn up much info, so figured I’d write a short description of what I’ve found.
最近在浏览 UIKit 的私有头部时,我遇到了一个以前没看过的类UIDebuggingInformationOverlay。 Google搜索没有找到太多的信息,所以我想写一个简短的描述,关于我发现了什么。
UIDebuggingInformationOverlay is a private UIWindow subclass created by Apple, presumably to help developers and designers debug Apple’s own iOS apps.
UIDebuggingInformationOverlay 是由 Apple 创建的一个私有的 UIWindow 子类,大概是帮助开发者和设计师调试苹果自己的 iOS App。
When enabled, the window floats over your app’s content, like so:
启用后,UIDebuggingInformationOverlay 会浮动在当前 App 的上层,如下所示:
In this post, I’ll show you how to make it display. I’ll also summarize its features, at least as I understand them.
这篇文章里,我将想你展示如何使 UIDebuggingInformationOverlay 显示出来。也会总结下他的功能。
How to show UIDebuggingInformationOverlay
如何显示 UIDebuggingInformationOverlay
There are two steps needed to show UIDebuggingInformationOverlay in all its glory:
- Call [UIDebuggingInformationOverlay prepareDebuggingOverlay] - I’m not sure exactly what this method does, but the overlay will be empty if you don’t call it.
- Call [[UIDebuggingInformationOverlay overlay] toggleVisibility] - This shows the overlay window (assuming it’s not already visible).
显示 UIDebuggingInformationOverlay的两个步骤:
- 调用
[UIDebuggingInformationOverlay prepareDebuggingOverlay]- 我不清楚这个方法究竟是做什么的,但是如果不调用它,覆盖图将是空的。 - 调用
[[UIDebuggingInformationOverlay overlay] toggleVisibility]- 显示覆盖窗口(假设它不是可见的)。
Because the class and its methods are private, you’ll need to jump through a few hoops to get the code to compile. One approach is to use the global ‘NSClassFromString’ and ‘NSSelectorFromString’ functions. In Swift, this approach looks something like:
因为 UIDebuggingInformationOverlay 类 和它的方法是私有的,你需要跳过几个环节去得到需要的代码完成编译。一种途径是使用全局 NSClassFromString 和 NSSelectorFromString 函数。在 Swift 中,这种方法看起来像:
let overlayClass = NSClassFromString("UIDebuggingInformationOverlay") as? UIWindow.Type
_ = overlayClass?.perform(NSSelectorFromString("prepareDebuggingOverlay"))
let overlay = overlayClass?.perform(NSSelectorFromString("overlay")).takeUnretainedValue() as? UIWindow
_ = overlay?.perform(NSSelectorFromString("toggleVisibility"))
However you choose to do it, be sure that the code doesn’t make it into your App Store build, else you’re likely to get rejected.
但是如果你选择这样做,请确保代码不会进入您的 App Store 构建,否则您可能会被拒审。
Update, May 26, 2017: Thanks to Bryce Pauken, who who discovered that once you’ve called [UIDebuggingInformationOverlay prepareDebuggingOverlay], you can just tap the status bar with two fingers to show the console. No need to call toggleVisibility.
更新,2017年5月26日:感谢 Bryce Pauken,发现当你打了 [UIDebuggingInformationOverlay prepareDebuggingOverlay] ,你可以用两根手指点击状态栏来显示控制台。无需调用 toggleVisibility。
What UIDebuggingInformationOverlay can do
UIDebuggingInformationOverlay 可以做什么
As you can see from the above screenshot, the overlay provides seven features. I’ll give a brief overview of the first six. I wasn’t able to get the ‘System Color Audit’ screen to show me anything, send me a message if you have better luck.
从上面的屏幕截图可以看出,覆盖层提供了 7 种功能。我会简要介绍一下前 6 个。我无法获得 System Color Audit 屏幕来显示任何内容,如果你做到了请联系我。
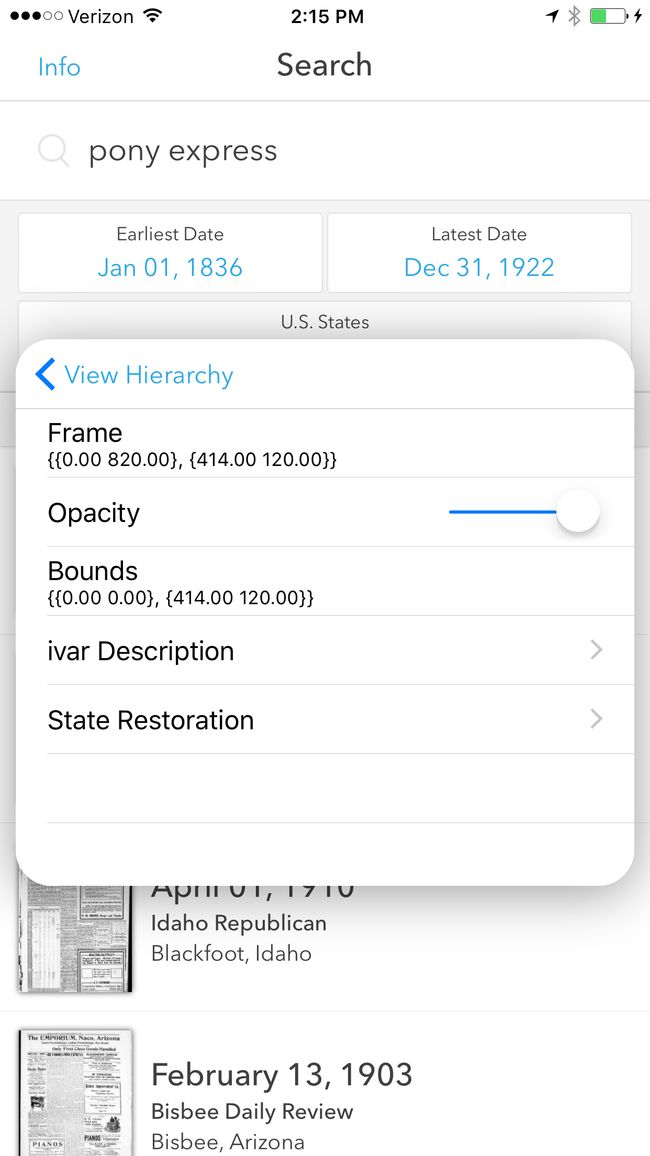
The 'View Hierarchy' screen(视图层次)
This screen shows what you’d probably expect; a list of views in the selected window. From here, you can inspect any view’s details, including its frame and instance variables. You can also switch between windows if you have more than one, or are just curious to see how a system window is built.
这个选项会展示选中的 window 上的 所有的 view,正如你期望的一样。从这里,您可以检查任何 view 的细节,包括 frame 和 实例变量。如果您有多个窗口,还可以在窗口之间切换,或者只是想知道如何构建系统窗口。
The 'VC Hierarchy' screen (控制器层次)
You can probably predict what this screen does as well. It’s very similar to the ‘View Hierarchy’ screen, except that it shows the hierarchy of active view controllers. From here, you can inspect any view controller’s details, including its view. You can also see whether the view controller is presenting a modal or is itself being presented.
您可以预测此屏幕的作用。 它与 View Hierarchy 功能非常相似,只是它显示了 view controllers 的层次结构。 从这里,你可以查看任何视图控制器的细节,包括它的 view。 您还可以看到 view controller 的状态是 modal 或 presented。
The 'Ivar Explorer' screen
This screen gives you access to the UIApplication instance’s variables. More importantly, any object variables can also be explored. This includes the app delegate which, depending on your app’s structure, might provide a handy entry point into your custom objects.
这个选项可让您访问 UIApplication 的实例变量。 更重要的是,还可以探索任何对象变量。 包括 delegate,根据应用程序的结构,可以为您的自定义对象提供一个便利的访问方式。
The 'Measure' screen
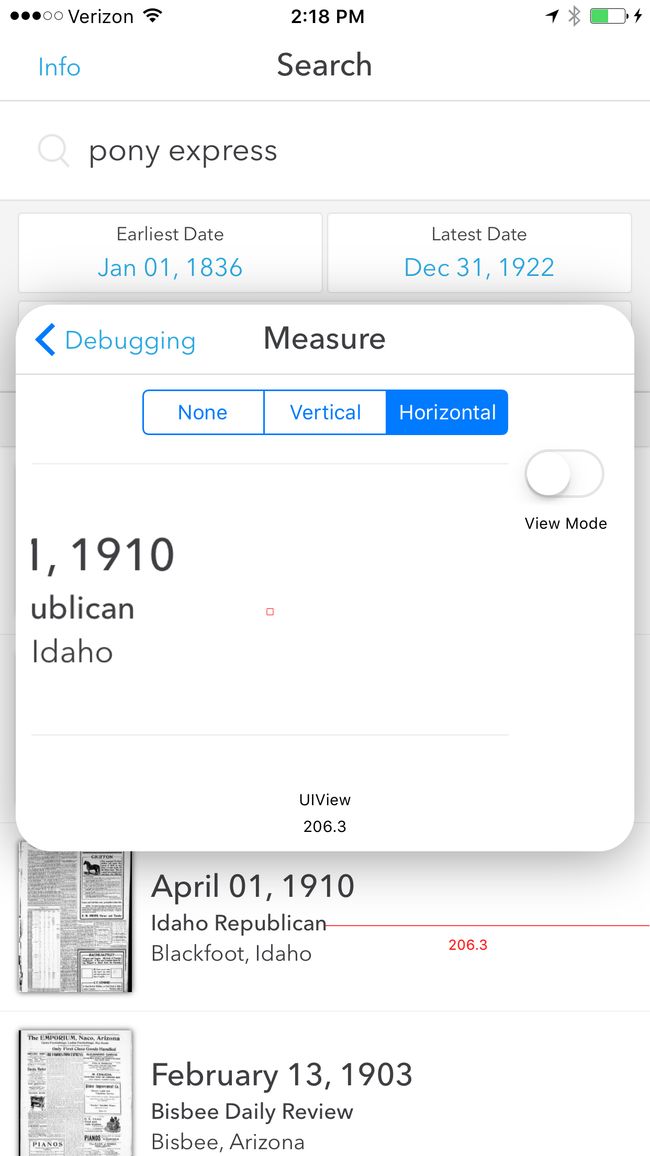
This is one of the cooler features of the overlay, in my opinion. It lets you measure dimensions (in points) of the screen’s elements. First, select whether you want to see measurements on the ‘Horizontal’ or ‘Vertical’ axis. Then drag your finger along the screen, using the magnified viewer inside the console to assist you. There are two modes:
在我看来,这是覆盖层的一个不常用的功能。它可以测量屏幕的尺寸(以点为单位)。 首先,选择是否要在 水平 或 垂直 轴上测量。 然后在屏幕上拖动手指,使用控制台内的放大查看器来协助您。 有两种模式:
The default mode ignores view boundaries. As far as I can tell, this mode treats the screen as a single rasterized image, and uses changes in color as boundaries for potential measurements. For example, in the screenshot below, I am able to measure the distance between the end of a label’s text and the edge of the screen:
默认模式忽略视图边界。 据我所知,此模式将屏幕视为单个光栅化图像,并将颜色变化用作潜在测量的边界。 例如,在下面的截图中,我可以测量 Label 末尾与屏幕边缘之间的距离:
“View mode”, on the other hand, displays the size of the subview in focus. Drag your finger over a view to see the selected axis’s dimension. In this screenshot, I’m measuring the height of the textfield at the top of the screen:
View mode 另一方面,可以显示子视图的大小。将手指拖动到视图上查看所选方向的尺寸。这张截图中,我在测量 textfield 的高度。
The 'Spec Compare' screen
I could see this being an incredibly useful tool for collaboration between development and design. Add a screenshot to your device and then select it from the Spec Compare screen. The selected screenshot will be displayed on top of the live app. You can then drag down to decrease alpha and compare the spec to the actual implementation.
我可以看到这是开发和设计之间协作的一个非常有用的工具。 将屏幕截图添加到设备,然后选择 Spec Compare 。 所选屏幕截图将显示在 App 的顶部。 然后,您可以向下拖动以减少透明度,并将其与实际需求进行比较。
Update, May 26, 2017: Patrick Balestra reminded me that I left out an important step. You’ll need to include a value for the NSPhotoLibraryUsageDescription key in your Info.plist. Tapping the ‘Add’ button presents a UIImagePickerController
, and doing so without setting this value will cause your app to crash.
更新,2017年5月26日:Patrick Balestra 提醒我,我缺少重要的一步。 你需要在 Info.plist 中包含 NSPhotoLibraryUsageDescription 键的值。 点击“添加”按钮显示一个 UIImagePickerController
,而不设置此值将导致您的应用程序崩溃。
Wrap-up
I’ve only had a few days to play with this thing but am hoping to put it to use in our next beta. The console has a few rough edges, but it seems like a promising alternative to many of the open-source tools out there. If you have a chance to use it and notice anything that I missed, please feel free to reach out. I’ll update the post as I learn more.
我只玩了几天玩这个东西,但希望在下一个测试版中使用它。 控制台有一些粗糙的边缘,但它似乎是许多开放源代码工具的有前途的替代品。 如果您有机会使用它并注意到我没注意到的地方,请随时联系。 我会更多的了解更多信息。


