MNIST 手写数字识别(一)
MNIST 手写数字识别模型建立与优化
本篇的主要内容有:
- TensorFlow 处理MNIST数据集的基本操作
- 建立一个基础的识别模型
- 介绍 S o f t m a x Softmax Softmax回归以及交叉熵等
MNIST是一个很有名的手写数字识别数据集(基本可以算是“Hello World”级别的了吧),我们要了解的情况是,对于每张图片,存储的方式是一个 28 * 28 的矩阵,但是我们在导入数据进行使用的时候会自动展平成 1 * 784(28 * 28)的向量,这在TensorFlow导入很方便,在使用命令下载数据之后,可以看到有四个数据集:

模型
来看一个最基础的模型建立,首先了解TensoFlow对MNIST数据集的一些操作
1.TensorFlow 对MNIST数据集的操作
下载、导入
from tensorflow.examples.tutorials.mnist import input_data
# 第一次运行会自动下载到代码所在的路径下

mnist = input_data.read_data_sets('location', one_hot=True)
# location 是保存的文件夹的名称
打印MNIST数据集的一些信息,通过这些我们就可以知道这些数据大致如何使用了
# 打印 mnist 的一些信息

from tensorflow.examples.tutorials.mnist import input_data
mnist = input_data.read_data_sets('MNIST_data', one_hot=True)

print("type of 'mnist is %s'" % (type(mnist)))
print("number of train data is %d" % mnist.train.num_examples)
print("number of test data is %d" % mnist.test.num_examples)

# 将所有的数据加载为这样的四个数组 方便之后的使用
trainimg = mnist.train.images
trainlabel = mnist.train.labels
testimg = mnist.test.images
testlabel = mnist.test.labels

print("Type of training is %s" % (type(trainimg)))
print("Type of trainlabel is %s" % (type(trainlabel)))
print("Type of testing is %s" % (type(testimg)))
print("Type of testing is %s" % (type(testlabel)))
输出结果:
type of 'mnist is '
number of train data is 55000    # 训练集共有55000条数据
number of test data is 10000     # 训练集有10000条数据
Type of training is     # 四个都是Numpy数组的类型
Type of trainlabel is
Type of testing is
Type of testing is
如果我们想看一看每条数据保存的图片是什么样子,可以使用 matplot()函数
# 接上面的代码

nsmaple = 5
randidx = np.random.randint(trainimg.shape[0], size=nsmaple)

for i in randidx:
    curr_img = np.reshape(trainimg[i,:], (28, 28))  # 数据中保存的是 1*784 先reshape 成 28*28
    curr_label = np.argmax(trainlabel[i, :])
    plt.matshow(curr_img, cmap=plt.get_cmap('gray'))
    plt.show()
通过上面的代码可以看出数据集中的一些特点,下面建立一个简单的模型来识别这些数字。
2.简单逻辑回归模型建立
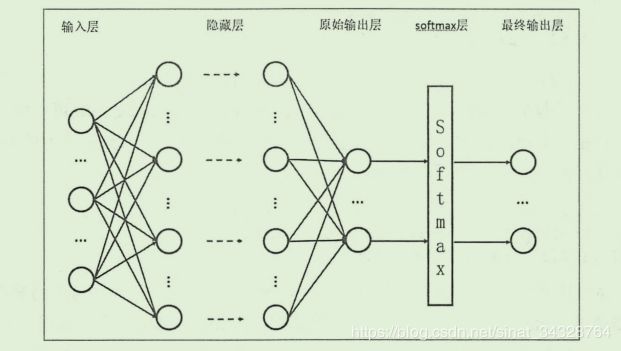
显然,这是一个逻辑回归(分类)的问题,首先来建立一个最简单的模型,之后会逐渐地优化。分类模型一般会采用交叉熵方式作为损失函数,所以,对于这个模型的输出,首先使用 S o f t m a x Softmax Softmax 回归方式处理为概率分布,然后采用交叉熵作为损失函数,使用梯度下降的方式进行优化。
需要注意的地方直接卸载代码注释中了,只要根据这个过程走一遍,其实就很好理解了。(其实代码并不长,只是注释写的多,都记下来,防止以后忘了没处看 =_=||| )。
import tensorflow as tf
from tensorflow.examples.tutorials.mnist import input_data

# 读入数据  ‘MNIST_data’ 是我保存数据的文件夹的名称
mnist = input_data.read_data_sets('MNIST_data', one_hot=True)

# 各种图片数据以及标签 images是图像数据  labels 是正确的结果
trainimg = mnist.train.images
trainlabels = mnist.train.labels
testimg = mnist.test.images
testlabels = mnist.test.labels

# 输入的数据 每张图片的大小是 28 * 28,在提供的数据集中已经被展平乘了 1 * 784(28 * 28)的向量
# 方便矩阵乘法处理
x = tf.placeholder(tf.float32, [None, 784])
# 输出的结果是对于每一张图输出的是 1*10 的向量,例如 [1, 0, 0, 0...]
# 只有一个数字是1 所在的索引表示预测数据
y = tf.placeholder(tf.float32, [None, 10])

# 模型参数
# 对于这样的全连接方式 某一层的参数矩阵的行数是输入数据的数量 ,列数是这一层的神经元个数
# 这一点用线性代数的思想考虑会比较好理解
W = tf.Variable(tf.zeros([784, 10]))
# 偏置
b = tf.Variable(tf.zeros([10]))

# 建立模型 并使用softmax()函数对输出的数据进行处理
# softmax() 函数比较重要 后面写
# 这里注意理解一下 模型输出的actv的shape 后边会有用(n * 10, n时输入的数据的数量)
actv = tf.nn.softmax(tf.matmul(x, W) + b)

# 损失函数 使用交叉熵的方式  softmax()函数与交叉熵一般都会结合使用
# clip_by_value()函数可以将数组整理在一个范围内,后面会具体解释
cost = tf.reduce_mean(-tf.reduce_sum(y * tf.log(tf.clip_by_value(actv, 1e-10, 1.0)), reduction_indices=1))

# 使用梯度下降的方法进行参数优化
learning_rate = 0.01
optm = tf.train.GradientDescentOptimizer(learning_rate).minimize(cost)

# 判断是否预测结果与正确结果是否一致
# 注意这里使用的函数的 argmax()也就是比较的是索引 索引才体现了预测的是哪个数字
# 并且 softmax()函数的输出不是[1, 0, 0...] 类似的数组 不会与正确的label相同
# pred 数组的输出是  [True, False, True...] 类似的
pred = tf.equal(tf.argmax(actv, 1), tf.argmax(y, 1))

# 计算正确率
# 上面看到pred数组的形式 使用cast转化为浮点数 则 True会被转化为 1.0, False 0.0
# 所以对这些数据求均值 就是正确率了(这个均值表示所有数据中有多少个1 -> True的数量 ->正确个数)
accr = tf.reduce_mean(tf.cast(pred, tf.float32))

init_op = tf.global_variables_initializer()

# 接下来要使用的一些常量 可能会自己根据情况调整所以都定义在这里
training_epochs = 50  # 一共要训练的轮数
batch_size = 100  # 每一批训练数据的数量
display_step = 5  # 用来比较、输出结果

with tf.Session() as sess:
    sess.run(init_op)
    # 对于每一轮训练
    for epoch in range(training_epochs):
        avg_cost = 0.
        # 计算训练数据可以划分多少个batch大小的组
        num_batch = int(mnist.train.num_examples / batch_size)

        # 每一组每一组地训练
        for i in range(num_batch):
            # 这里地 mnist.train.next_batch()作用是:
            # 第一次取1-10数据 第二次取 11-20 ... 类似这样
            batch_xs, batch_ys = mnist.train.next_batch(batch_size)
            # 运行模型进行训练
            sess.run(optm, feed_dict={x: batch_xs, y: batch_ys})
            # 如果觉得上面 feed_dict 的不方便 也可以提前写在外边
            feeds = {x: batch_xs, y: batch_ys}
            # 累计计算总的损失值
            avg_cost += sess.run(cost, feed_dict=feeds) / num_batch

        # 输出一些数据
        if epoch % display_step == 0:
            # 为了输出在训练集上的正确率本来应该使用全部的train数据 这里为了快一点就只用了部分数据
            feed_train = {x: trainimg[1: 100], y: trainlabels[1: 100]}
            # 在测试集上运行模型
            feedt_test = {x: mnist.test.images, y: mnist.test.labels}
            train_acc = sess.run(accr, feed_dict=feed_train)
            test_acc = sess.run(accr, feed_dict=feedt_test)

            print("Eppoch: %03d/%03d cost: %.9f train_acc: %.3f test_acc: %.3f" %
                  (epoch, training_epochs, avg_cost, train_acc, test_acc))
print("Done.")
输出结果:
Eppoch: 000/050 cost: 1.176410784 train_acc: 0.879 test_acc: 0.855
Eppoch: 005/050 cost: 0.440938284 train_acc: 0.919 test_acc: 0.896
Eppoch: 010/050 cost: 0.383333167 train_acc: 0.929 test_acc: 0.905
Eppoch: 015/050 cost: 0.357264753 train_acc: 0.939 test_acc: 0.909
Eppoch: 020/050 cost: 0.341510192 train_acc: 0.939 test_acc: 0.912
Eppoch: 025/050 cost: 0.330560439 train_acc: 0.939 test_acc: 0.914
Eppoch: 030/050 cost: 0.322391762 train_acc: 0.939 test_acc: 0.917
Eppoch: 035/050 cost: 0.315973353 train_acc: 0.939 test_acc: 0.917
Eppoch: 040/050 cost: 0.310739485 train_acc: 0.939 test_acc: 0.918
Eppoch: 045/050 cost: 0.306366821 train_acc: 0.939 test_acc: 0.919
Done.
可以看到,这个模型的正确率最后稳定在 92% 左右,不算高,毕竟只有一层处理。
下面来看几个重点:
S o f t m a x Softmax Softmax 回归
这个函数的作用是将一组数据转化为概率的形式,
函数表达式:
S o f t m a x ( x j ) = e x p ( x j ) ∑ j e x p ( x j ) Softmax(x_{j}) = \frac{exp(x_{j})}{\sum _{j} exp(x_{j})} Softmax(xj)=∑jexp(xj)exp(xj)
S o f t m a x Softmax Softmax回归可以将一组数据整理为一个概率分布,其实计算很简单,也很好理解,这里是用来处理模型的原本输出结果:

这是因为模型原本的输出可能是 ( 1 , 2 , 3... ) (1, 2, 3...) (1,2,3...)这样形式,无法使用交叉熵的方式进行衡量,所以先进行一次处理,举个例子就是,对于一个向量 ( 1 , 2 , , 3 ) (1, 2, ,3) (1,2,,3) 经过 S o f t m a x Softmax Softmax 回归之后就是 ( e 1 e 1 + e 2 + e 3 , e 2 e 1 + e 2 + e 3 , e 3 e 1 + e 2 + e 3 ) (\frac{e^{1}}{e^{1}+e^{2}+e^{3}},\frac{e^{2}}{e^{1}+e^{2}+e^{3}},\frac{e^{3}}{e^{1}+e^{2}+e^{3}}) (e1+e2+e3e1,e1+e2+e3e2,e1+e2+e3e3),这样就成为一个概率分布,方便接下来计算交叉熵了。
交叉熵的介绍
交叉熵(cross entropy)的概念取自信息论,刻画的是两个概率分布之间的距离,一般都会用在分类问题中,对于两个给定的概率分布 p 和 q,(注意:这里指的是 概率分布,不是单个的概率值,所以才会有下面公式中的求和运算)通过 q 来表示 p 的交叉熵表达为:
H ( p , q ) = − ∑ p ( x ) l o g q ( x ) H(p,q) = -\sum p(x)log \enspace q(x) H(p,q)=−∑p(x)logq(x)
这里还是要解释一下,使用交叉熵的前提:概率分布 p(X=x)必须要满足:
∀ x p ( X = x ) ∈ [ 0 , 1 ] a n d ∑ p ( X = x ) = 1 \forall x p(X=x)\in [0,1] \enspace and \enspace \sum p(X=x)=1 ∀xp(X=x)∈[0,1]and∑p(X=x)=1
现在可以理解为什么要先使用 s o f t m a x softmax softmax回归对输出地数据先进行处理了吧,本来模型对于一张图片的输出是不符合概率分布的,所以经过 s o f t m a x softmax softmax回归转化之后,就可以使用交叉熵来衡量了。
如果通俗地理解交叉熵,可以理解为用给定的一个概率分布表达另一个概率分布的困难程度,如果两个概率分布越接近,那么显然这种困难程度就越小,那么交叉熵就会越小,回到MNIST中,我们知道对于某一张图片的label,也就是正确分类是这样的形式:(1, 0, 0, …) ,对于这张图片,我们的模型的输出可能是 (0.5, 0.3, 0.2) 这样的形式,那么计算交叉熵就是 − ( 1 × l o g ( 0.5 ) + 0 × l o g ( 0.3 ) + 0 × l o g ( 0.2 ) ) -(1 \times log(0.5) + 0 \times log(0.3) + 0 \times log(0.2)) −(1×log(0.5)+0×log(0.3)+0×log(0.2)) ,这样就计算出了交叉熵,在上面程序中 lost函数中就是这样计算的。这里还用到了一个函数 : tf.clip_by_value(),这个函数是将数组中的值限定在一个范围内,上面程序的片段:
# 损失函数 使用交叉熵的方式  softmax()函数与交叉熵一般都会结合使用
cost = tf.reduce_mean(-tf.reduce_sum(y * tf.log(tf.clip_by_value(actv, 1e-10, 1.0)), reduction_indices=1))
虽然模型的输出一般不会出现某个元素为0这种情况,但是这样并不保险,一旦出现actv中某个元素为0,根据交叉熵的计算,就会出现 log(0) 的情况,所以最好对这个数组加以限制,对于clip_by_value()函数,定义如下:
def clip_by_value(t: Any,           # 这个参数就是需要整理的数组
                  clip_value_min: Any,    # 最小值
                  clip_value_max: Any,    # 最大值
                  name: Any = None) ->
# 经过这个函数,数组中小于clip_value_min 的元素就会被替换为clip_value_min, 同样,超过的也会被替换
# 所以用在交叉熵中就保证了计算的合法
这样,很明显,交叉熵越小,也就说明模型地输出越接近正确的结果,这也是使用交叉熵描述损失函数地原因,接下来使用梯度下降(这里是)不断更新参数,找到最小地lost,就是最优的模型了。
以上~