python地铁路线可视化
python地铁路线可视化
- 事前准备
- 绘制地铁站点路线图
- 利用百度api获取地铁站点坐标[^1]
- 经纬度坐标系的转换[^2]
- 绘制地铁路线图[^3]
- 设置地图默认语言为中文[^4]
- 绘制精细地铁线路图
- 利用百度api获取精细地铁线路百度墨卡托(BD-09MC)坐标[^1]
- 提取地铁路线经纬度坐标序列
- 绘制地铁路线图
事前准备
- 需要安装的第三方库:plotly、requests、numpy
- 由于plotly使用的地图api是mapbox,我们需要先注册一个mapbox的账号,之后可在Account界面下获取一个token备用,也可直接使用我代码中所用的token而无需注册
绘制地铁站点路线图
利用百度api获取地铁站点坐标1
百度地图获取城市地铁站点信息的api为http://map.baidu.com/?qt=bsi&c={城市编号}&t={13位时间戳},这里附上百度地图城市编号文件:BaiduMap_cityCode
有了api之后,我们以广州为例,获取广州所有地铁站点信息,代码如下import requests
import time
null = None #将json中的null定义为None
city_code = 257 #广州的城市编号
station_info = requests.get('http://map.baidu.com/?qt=bsi&c=%s&t=%s' % (
city_code,
int(time.time() * 1000)
)
)
station_info_json = eval(station_info.content) #将json字符串转为python对象
这样处理以后我们会得到json格式的字典,其中键名为content的内容是我们感兴趣的线路信息字典组成的列表,其中每一个字典为一条线路的信息,现给出线路字典的键值信息如下
| 键名 | 描述 | 数据类型 |
|---|---|---|
| line_name | 线路名 | str |
| line_uid | 线路uid | str |
| pair_line_uid | 反向线路uid | str |
| stops | 站点信息 | dict |
而每一个站点信息字典的键值信息如下
| 键名 | 描述 | 数据类型 |
|---|---|---|
| is_practical | 未知 | int |
| name | 站点名字 | str |
| uid | 站点uid | str |
| x | 站点百度墨卡托x坐标 | float |
| y | 站点百度墨卡托y坐标 | float |
这样我们可提取出我们所需的各条地铁线路的站点名及百度墨卡托(BD-09MC)坐标,代码如下
for line in station_info_json['content']:
plots = []
plots_name = []
for plot in line['stops']:
plots.append([plot['x'], plot['y']])
plots_name.append(plot['name'])
plot_mercator = np.array(plots)
#......
经纬度坐标系的转换2
由于mapbox采用WGS-84坐标系,我们还得将提取出的BD-09MC坐标转换为WGS-84坐标系下的经纬度,要做到这一点,我们先将BD-09MC坐标转换到BD-09坐标系(百度的另一个坐标系)下,再转到GCJ-02坐标系(国内常用的坐标系)下,之后才能转换到WGS-84坐标系下,关于这几个坐标系就不在此赘述了,下面提供几个转换函数
import numpy as np
import math
PI = math.pi
def _transformlat(coordinates):
lng = coordinates[ : , 0] - 105
lat = coordinates[ : , 1] - 35
ret = -100 + 2 * lng + 3 * lat + 0.2 * lat * lat + \
0.1 * lng * lat + 0.2 * np.sqrt(np.fabs(lng))
ret += (20 * np.sin(6 * lng * PI) + 20 *
np.sin(2 * lng * PI)) * 2 / 3
ret += (20 * np.sin(lat * PI) + 40 *
np.sin(lat / 3 * PI)) * 2 / 3
ret += (160 * np.sin(lat / 12 * PI) + 320 *
np.sin(lat * PI / 30.0)) * 2 / 3
return ret
def _transformlng(coordinates):
lng = coordinates[ : , 0] - 105
lat = coordinates[ : , 1] - 35
ret = 300 + lng + 2 * lat + 0.1 * lng * lng + \
0.1 * lng * lat + 0.1 * np.sqrt(np.fabs(lng))
ret += (20 * np.sin(6 * lng * PI) + 20 *
np.sin(2 * lng * PI)) * 2 / 3
ret += (20 * np.sin(lng * PI) + 40 *
np.sin(lng / 3 * PI)) * 2 / 3
ret += (150 * np.sin(lng / 12 * PI) + 300 *
np.sin(lng / 30 * PI)) * 2 / 3
return ret
def gcj02_to_wgs84(coordinates):
"""
GCJ-02转WGS-84
:param coordinates: GCJ-02坐标系的经度和纬度的numpy数组
:returns: WGS-84坐标系的经度和纬度的numpy数组
"""
ee = 0.006693421622965943 # 偏心率平方
a = 6378245 # 长半轴
lng = coordinates[ : , 0]
lat = coordinates[ : , 1]
is_in_china= (lng > 73.66) & (lng < 135.05) & (lat > 3.86) & (lat < 53.55)
_transform = coordinates[is_in_china] #只对国内的坐标做偏移
dlat = _transformlat(_transform)
dlng = _transformlng(_transform)
radlat = _transform[ : , 1] / 180 * PI
magic = np.sin(radlat)
magic = 1 - ee * magic * magic
sqrtmagic = np.sqrt(magic)
dlat = (dlat * 180.0) / ((a * (1 - ee)) / (magic * sqrtmagic) * PI)
dlng = (dlng * 180.0) / (a / sqrtmagic * np.cos(radlat) * PI)
mglat = _transform[ : , 1] + dlat
mglng = _transform[ : , 0] + dlng
coordinates[is_in_china] = np.array([
_transform[ : , 0] * 2 - mglng, _transform[ : , 1] * 2 - mglat
]).T
return coordinates
def bd09_to_gcj02(coordinates):
"""
BD-09转GCJ-02
:param coordinates: BD-09坐标系的经度和纬度的numpy数组
:returns: GCJ-02坐标系的经度和纬度的numpy数组
"""
x_pi = PI * 3000 / 180
x = coordinates[ : , 0] - 0.0065
y = coordinates[ : , 1] - 0.006
z = np.sqrt(x * x + y * y) - 0.00002 * np.sin(y * x_pi)
theta = np.arctan2(y, x) - 0.000003 * np.cos(x * x_pi)
lng = z * np.cos(theta)
lat = z * np.sin(theta)
coordinates = np.array([lng, lat]).T
return coordinates
def bd09_to_wgs84(coordinates):
"""
BD-09转WGS-84
:param coordinates: BD-09坐标系的经度和纬度的numpy数组
:returns: WGS-84坐标系的经度和纬度的numpy数组
"""
return gcj02_to_wgs84(bd09_to_gcj02(coordinates))
def mercator_to_bd09(mercator):
"""
BD-09MC转BD-09
:param coordinates: GCJ-02坐标系的经度和纬度的numpy数组
:returns: WGS-84坐标系的经度和纬度的numpy数组
"""
MCBAND = [12890594.86, 8362377.87, 5591021, 3481989.83, 1678043.12, 0]
MC2LL = [[1.410526172116255e-08, 8.98305509648872e-06, -1.9939833816331,
200.9824383106796, -187.2403703815547, 91.6087516669843,
-23.38765649603339, 2.57121317296198, -0.03801003308653,
17337981.2],
[-7.435856389565537e-09, 8.983055097726239e-06, -0.78625201886289,
96.32687599759846, -1.85204757529826, -59.36935905485877,
47.40033549296737, -16.50741931063887, 2.28786674699375,
10260144.86],
[-3.030883460898826e-08, 8.98305509983578e-06, 0.30071316287616,
59.74293618442277, 7.357984074871, -25.38371002664745,
13.45380521110908, -3.29883767235584, 0.32710905363475,
6856817.37],
[-1.981981304930552e-08, 8.983055099779535e-06, 0.03278182852591,
40.31678527705744, 0.65659298677277, -4.44255534477492,
0.85341911805263, 0.12923347998204, -0.04625736007561,
4482777.06],
[3.09191371068437e-09, 8.983055096812155e-06, 6.995724062e-05,
23.10934304144901, -0.00023663490511, -0.6321817810242,
-0.00663494467273, 0.03430082397953, -0.00466043876332,
2555164.4],
[2.890871144776878e-09, 8.983055095805407e-06, -3.068298e-08,
7.47137025468032, -3.53937994e-06, -0.02145144861037,
-1.234426596e-05, 0.00010322952773, -3.23890364e-06,
826088.5]]
x = np.abs(mercator[ : , 0])
y = np.abs(mercator[ : , 1])
coef = np.array([
MC2LL[index] for index in
(np.tile(y.reshape((-1, 1)), (1, 6)) < MCBAND).sum(axis=1)
])
return converter(x, y, coef)
def converter(x, y, coef):
x_temp = coef[ : ,0] + coef[ : ,1] * np.abs(x)
x_n = np.abs(y) / coef[ : ,9]
y_temp = coef[ : ,2] + coef[ : ,3] * x_n + coef[ : ,4] * x_n ** 2 + \
coef[ : ,5] * x_n ** 3 + coef[ : ,6] * x_n ** 4 + coef[ : ,7] * x_n ** 5 + \
coef[ : ,8] * x_n ** 6
x[x < 0] = -1
x[x >= 0] = 1
y[y < 0] = -1
y[y >= 0] = 1
x_temp *= x
y_temp *= y
coordinates = np.array([x_temp, y_temp]).T
return coordinates
绘制地铁路线图3
接下来就可利用plotly绘制出地铁站点路线图了,代码如下
import plotly.offline as py
import plotly.graph_objs as go
from plotly.offline import init_notebook_mode
init_notebook_mode(connected=True) #如果使用jupyter需要加上这一句,把地图显示在页面上
mapbox_access_token = (
'pk.eyJ1IjoibHVrYXNtYXJ0aW5lbGxpIiwiYSI6ImNpem85dmhwazAy'
'ajIyd284dGxhN2VxYnYifQ.HQCmyhEXZUTz3S98FMrVAQ'
) # 此处的写法只是为了排版,结果为连接在一起的字符串
layout = go.Layout(
autosize=True,
mapbox=dict(
accesstoken=mapbox_access_token,
center=dict(
lat=23.12864583, #广州市纬度
lon= 113.2648325 #广州市经度
),
pitch=0,
zoom=10,
),
)
color = ('blue', 'green', 'yellow', 'purple', 'orange', 'red', 'violet',
'navy', 'crimson', 'cyan', 'magenta', 'maroon', 'peru') #可按需增加
data = [] #绘制数据
marked = set()
cnt = 0
for line in station_info_json['content']:
uid = line['line_uid']
if uid in marked: #由于线路包括了来回两个方向,需要排除已绘制线路的反向线路
continue
plots = [] #站台BD-09MC坐标
plots_name = [] #站台名称
for plot in line['stops']:
plots.append([plot['x'], plot['y']])
plots_name.append(plot['name'])
plot_mercator = np.array(plots)
plot_coordinates = bd09_to_wgs84(mercator_to_bd09(plot_mercator)) #站台经纬度
data.append(
go.Scattermapbox(
lon=plot_coordinates[:, 0], #站台经度
lat=plot_coordinates[:, 1], #站台纬度
mode='markers+lines',
name=line['line_name'], #线路名称,显示在图例(legend)上
text=plots_name, #各个点的名称,鼠标悬浮在点上时显示
# 设置标记点的参数
marker=go.scattermapbox.Marker(
size=10,
color=color[cnt]
),
)
)
marked.add(uid) #添加已绘制线路的uid
marked.add(line['pair_line_uid']) #添加已绘制线路反向线路的uid
cnt = (cnt + 1) % len(color)
fig = dict(data=data, layout=layout)
#py.iplot(fig) #直接显示地图
py.plot(fig, filename='Guangzhou_railway.html') #生成html文件并打开
如想获取更多颜色可参考https://www.cnblogs.com/darkknightzh/p/6117528.html
完整的代码文件
设置地图默认语言为中文4
将地铁路线图绘制出来后,我们会发现里面的地点名是中英混合的,原因在于plotly使用的mapbox的默认语言是英文,而有些地点名没有英文名称就显示为中文了。为了解决这个问题,我去翻过了plotly的api,遗憾的是没有找到相关的配置,最后只能修改生成的html文件将默认语言设置为中文了(其实我对前端一窍不通),步骤如下
- 在工作目录下找到生成的html文件,把里面的代码用js相关工具格式化一下,我这里使用了在线格式化工具,将格式化的代码保存下来
- 在head标签内添加如下代码
<script src='https://api.mapbox.com/mapbox-gl-js/plugins/mapbox-gl-language/v0.10.0/mapbox-gl-language.js'>script>
如图所示

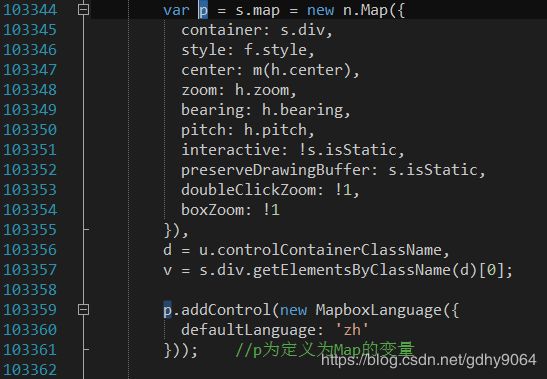
3. 在代码中搜索”Map({“(如果使用正则表达式要注意加上转义),找到定义Map的地方,在后面添加如下代码
p.addControl(new MapboxLanguage({
defaultLanguage: 'zh'
})); //p是定义为Map类型的变量
如图所示

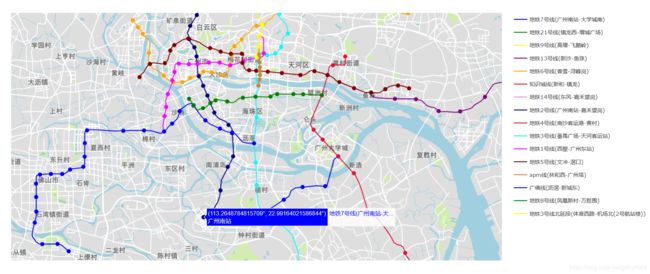
这样修改之后打开该html文件就能以中文地名显示了,可视化效果如图
这时候可能有挑剔的小伙伴会说:“这地铁路线图看上去好假啊喂(嫌弃)。“那么接下来我们再来绘制更加精细的地铁路线图。
绘制精细地铁线路图
利用百度api获取精细地铁线路百度墨卡托(BD-09MC)坐标1
百度地图获取城市精细地铁线路坐标的api为https://map.baidu.com/?qt=bsl&tps=&newmap=1&uid={地铁线路uid}&c={城市编号},获取广州精细地铁线路坐标的代码如下
import requests
import time

null = None #将json中的null定义为None
city_code = 257 #广州的城市编号
station_info = requests.get('http://map.baidu.com/?qt=bsi&c=%s&t=%s' % (
                    city_code,
                    int(time.time() * 1000)
               )
)
station_info_json = eval(station_info.content) #将json字符串转为python对象
for railway in station_info_json['content']:
uid = railway['line_uid']
railway_json = requests.get(
'https://map.baidu.com/?qt=bsl&tps=&newmap=1&uid=%s&c=%s' % (uid, city_id)
)
railway_json = eval(railway_json.content) #将json字符串转为python对象
#......
这样做之后我们同样得到了一个字典,键名为content的内容是长度为1的保存了线路信息字典的列表,现给出线路信息字典的部分键值信息如下
| 键名 | 描述 | 数据类型 |
|---|---|---|
| geo | 整条线路坐标信息,以 ”|“ 为分隔符分为三部分,第三部分为该线路 有序的BD-09MC坐标,格式为" x 1 , y 1 , x 2 , y 2 , . . . , x n , y n ; x_1,y_1,x_2,y_2,...,x_n,y_n; x1,y1,x2,y2,...,xn,yn;" |
str |
| stations | 具体站点信息 | list |
| uid | 地铁路线uid | str |
| lineColor | 线路16进制RGB | str |
提取地铁路线经纬度坐标序列
有了上面获取到的字典,我们可以提取出里面的BD-09MC坐标并转换成WGS-84坐标,代码如下
    trace_mercator = np.array(
        # 取出线路信息字典,以“|”划分后,取出第三部分信息,去掉末尾的“;”,获取BD-09MC坐标序列
        railway_json['content'][0]['geo'].split('|')[2][ : -1].split(','),
        dtype=float
    ).reshape((-1, 2))
    trace_coordinates = bd09_to_wgs84(mercator_to_bd09(trace_mercator))
绘制地铁路线图
与前面的绘制路线图的代码整合后,最新的绘制代码如下
mapbox_access_token = (
    'pk.eyJ1IjoibHVrYXNtYXJ0aW5lbGxpIiwiYSI6ImNpem85dmhwazAy'
    'ajIyd284dGxhN2VxYnYifQ.HQCmyhEXZUTz3S98FMrVAQ'
) # 此处的写法只是为了排版,结果为连接在一起的字符串
layout = go.Layout(
    autosize=True,
    mapbox=dict(
        accesstoken=mapbox_access_token,
        bearing=0,
        center=dict(
            lat=23.12864583, #广州市纬度
            lon= 113.2648325 #广州市经度
        ),
        pitch=0,
        zoom=10
    ),
)

null = None #将json中的null定义为None
city_code = 257 #广州的城市编号
data = [] #绘制数据
marked = set()
for railway in station_info_json['content']:
    uid = railway['line_uid']
    if uid in marked: #由于线路包括了来回两个方向,需要排除已绘制线路的反向线路
        continue

    railway_json = requests.get(
        'https://map.baidu.com/?qt=bsl&tps=&newmap=1&uid=%s&c=%s' % (uid, city_code)
    )
    railway_json = eval(railway_json.content) #将json字符串转为python对象
    trace_mercator = np.array(
        # 取出线路信息字典,以“|”划分后,取出第三部分信息,去掉末尾的“;”,获取BD-09MC坐标序列
        railway_json['content'][0]['geo'].split('|')[2][ : -1].split(','),
        dtype=float
    ).reshape((-1, 2))
    trace_coordinates = bd09_to_wgs84(mercator_to_bd09(trace_mercator))

    plots = [] #站台BD-09MC坐标
    plots_name = [] #站台名称
    for plot in railway['stops']:
        plots.append([plot['x'], plot['y']])
        plots_name.append(plot['name'])
    plot_mercator = np.array(plots)
    plot_coordinates = bd09_to_wgs84(mercator_to_bd09(plot_mercator)) #站台经纬度

    color = railway_json['content'][0]['lineColor'] #利用json所给线路的颜色
    data.extend([
        # 地铁路线
        go.Scattermapbox(
            lon=trace_coordinates[:, 0], #路线点经度
            lat=trace_coordinates[:, 1], #路线点纬度
            mode='lines',
            # 设置路线的参数
            line=go.scattermapbox.Line(
                width=2,
                color=color
            ),
            name=railway['line_name'], #线路名称,显示在图例(legend)上
            legendgroup=railway['line_name']
        ),

        # 地铁站台
        go.Scattermapbox(
            lon=plot_coordinates[:, 0], #站台经度
            lat=plot_coordinates[:, 1], #站台纬度
            mode='markers',
            text=plots_name,
            # 设置标记点的参数
            marker=go.scattermapbox.Marker(
                size=10,
                color=color
            ),
            name=railway['line_name'], #线路名称,显示在图例(legend)及鼠标悬浮在标记点时的路线名上
            legendgroup=railway['line_name'], #设置与路线同组,当隐藏该路线时隐藏标记点
            showlegend=False #不显示图例(legend)
        )
    ])

    marked.add(uid) #添加已绘制线路的uid
    marked.add(railway['pair_line_uid']) #添加已绘制线路反向线路的uid

fig = dict(data=data, layout=layout)
#py.iplot(fig) #直接显示地图
py.plot(fig, filename='Guangzhou_railway.html') #生成html文件并打开
最后,再通过上述同样的步骤完成地图默认语言的设置,即可得到最终效果,如图
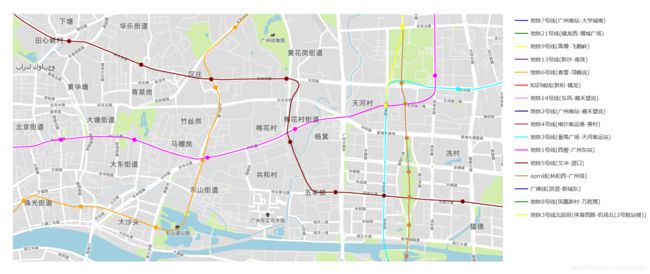
 放大后我们能够看出地铁路线与地图道路的匹配程度较好,如图
 完整的代码文件
2019.05.22更新:坐标系转换代码第57行bool_out_of_china更正为is_in_china
2019.07.07更新:更改错误描述“墨卡托”为“百度墨卡托(BD-09MC)”,更改参考2中非百度摩卡托坐标转换参考链接。
2019.07.30更新:更改原代码中mapbox_access_token的赋值操作,避免因缩进导致字符串中出现空格,进而导致认证失败,地图加载不出来
2019.09.25更新:新增城市公交百度api如下
百度地图获取城市公交信息的api为https://map.baidu.com/?qt=spot&c={城市编号}&wd=XX市公交&rn=50&t={13位时间戳},如https://map.baidu.com/?qt=spot&c=257&wd=广州市公交&rn=50&t=1563956728633
百度地图获取城市公交详细线路信息的api为https://map.baidu.com/?qt=bsl&uid={公交线路uid}&c={城市编号}&t={13位时间戳},如https://map.baidu.com/?qt=bsl&uid=89426be2781c4681f70e7757&c=257&t=1564015808798
地图地铁信息api参考http://www.yanweijia.cn/2016/07/24/subway_info_api/ ↩︎ ↩︎
非百度墨卡托坐标转换参考https://blog.csdn.net/pashine/article/details/81283390
百度墨卡托坐标转换参考https://www.jianshu.com/p/063bee79507a ↩︎plotly官方文档参考https://plot.ly/python/maps/
plotly python版api参考https://plot.ly/python/reference/ ↩︎html文件设置mapbox的默认语言参考https://blog.csdn.net/hyzhang6/article/details/79760166 ↩︎