python直方图/饼图/散点图的画法
import numpy  as np
import pandas as pd
import matplotlib.pyplot as plt
% matplotlib inline
from matplotlib.pyplot import *
1.直方图
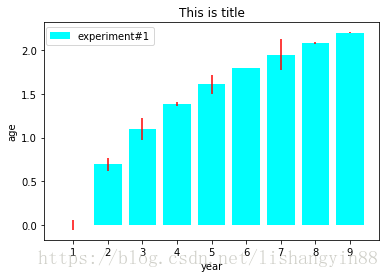
x=np.arange(0,10,1)
y=np.log(x)
xe=0.1*np.abs(np.random.randn(len(y)))
plt.bar(x,y,yerr=xe,align='center',ecolor='r',color='cyan',label='experiment#1')
plt.xlabel('year')#添加x轴的标签
plt.ylabel('age')#添加y轴的标签
plt.title('This is title')#添加标题
plt.legend(bbox_to_anchor=(-0.01,1,1,0),ncol=3,loc='upper left')#控制图例的位置,legend图例的默认描述与label的相同experiment#1
plt.gca().xaxis.set_major_locator(matplotlib.ticker.MultipleLocator(1))#控制X轴的标签为1的整数倍
2.饼图
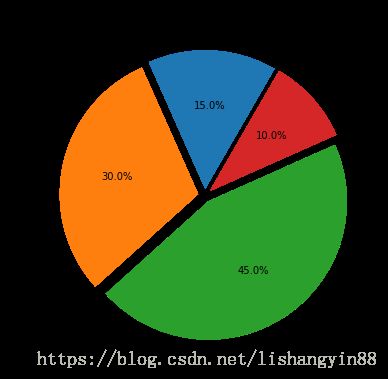
figure(figsize=(6,6))
ax=axes([0.1,0.1,0.8,0.8])#建立轴的大小
labels='Springs','Summer','Autumn','Winter'
x=[15,30,45,10]
explode=(0.05,0.05,0.05,0.05)#这个是控制分离的距离的,默认的饼图不分离。
pie(x,labels=labels,explode=explode,startangle=60,autopct='%1.1f%%')#qutopct在图中显示比例值,注意值的格式。
title('Rany days by season')
3.散点图
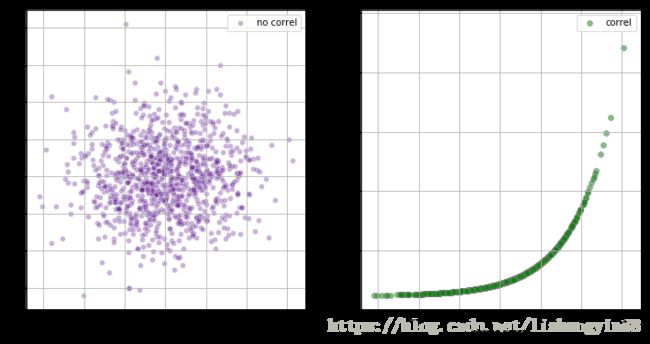
x=np.random.randn(1000)
figure(figsize=(12,6))
y1=np.random.randn(len(x))
y2=1.2+np.exp(x)
ax1=plt.subplot(121)
plt.scatter(x,y1,color='indigo',alpha=0.3,edgecolors='white',label='no correl')
#要特别注意使用透明度alpha,这样得出的点的感觉完全就不同了。明显有些高大上的感觉。
plt.xlabel('no correl')
plt.legend()
plt.grid(True)
plt.subplot(122)
plt.scatter(x,y2,color='green',alpha=0.5,edgecolors='grey',label='correl')
plt.xlabel('strong correl')
plt.legend(loc='upper right')
plt.grid(True)
4.填充图表区域
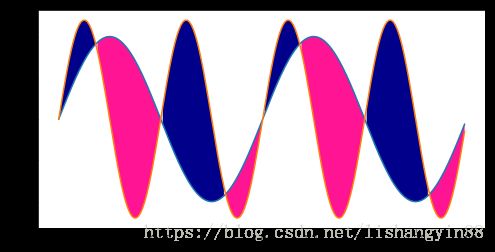
x=np.arange(0,2,0.01)
y1=np.sin(2*np.pi*x)
y2=1.2*np.sin(4*np.pi*x)
figure(1,figsize=(8,4))#定义图的大小,这里尤其要注意“=”,非常容易忘掉造成报错
plot(x,y1,x,y2)#原来还可以这么画图啊。
fill_between(x,y1,y2,where=y2>=y1,facecolor='darkblue')#where指定函数填充曲线,注意这种用法,是不是有些特别?
fill_between(x,y1,y2,where=y2<=y1,facecolor='deeppink')
