原理:
- 通过改变训练样本的权重,学习多个分类器,并将这些分类器进行线性组合,提高分类的性能;
- bagging是通过随机抽样的替换方式,得到与原数据集规模一样的数据;
- boosting在bagging的思路上更进一步,在数据集上顺序应用了多个不同的分类器。
优点:
- 泛化错误率低,易编码,可以用在大部分分类器上,无参数调整。
缺点:
适用数据类型:
import numpy as np
import pandas as pd
import matplotlib.pyplot as plt
def loadSimpData():
    dataMat = np.mat([[1.,2.1],
               [2.,1.1],
               [1.3,1.],
               [1.,1.],
               [2.,1.]])
    classLabels = [1.0,1.0,-1.0,-1.0,1.0]
    return dataMat,classLabels
dataMat,classLabels=loadSimpData()

#可视化
x = pd.DataFrame(dataMat)
y= pd.Series(classLabels)
pos = x[y==1].copy()
neg = x[y==-1].copy()
plt.figure()
plt.scatter(pos.loc[:,0],pos.loc[:,1],c='b',label='positive',marker='s')
plt.scatter(neg.loc[:,0],neg.loc[:,1],c='r',label='negative')
plt.show()
分类规则
def stumpClassify(dataMatrix,dimen,threshVal,threshIneq):
    retArray = np.ones((np.shape(dataMatrix)[0],1))
    if threshIneq == 'lt':
        retArray[dataMatrix[:,dimen] <= threshVal] =-1.0  #大小判断进行分类
    else: #threshIneq == 'gt'
        retArray[dataMatrix[:,dimen] > threshVal] =-1.0
    return retArray
遍历所有特征找到最小误差对应的特征、阈值和分类规则
def buildStump(dataArr,classLabels,D):
    dataMatrix = np.mat(dataArr);labelMat = np.mat(classLabels).T
    m,n=np.shape(dataMatrix)
    numSteps = 10.0; bestStump = {}; bestClassEst = np.mat(np.zeros((m,1)))
    minError=np.inf
    for i in range(n):
        rangeMin = dataMatrix[:,i].min() #取第i个特征的最小值
        rangeMax = dataMatrix[:,i].max() #取第i个特征的最大值
        stepSize = (rangeMax - rangeMin)/numSteps #设置步长
        for j in range(-1,int(numSteps)+1): #j:-1到11,用于遍历不同的阈值
            for inequal in ['lt','gt']: #lt:less than; gt: great than
                threshVal = rangeMin + float(j)*stepSize #设置阈值,按一个步长一个步长往上增加
                predictedVals = stumpClassify(dataMatrix,i,threshVal,inequal) #分类结果
                errArr = np.mat(np.ones((m,1))) #初始化误差矩阵
                errArr[predictedVals == labelMat] = 0 #正确分类的误差为0
                weightedError = D.T*errArr #计算分类误差率,参考李航P139
#                 print("split: dim %d, thresh %.2f, thresh ineqal: %s, the weighted error is %.3f" %(i,threshVal,inequal,weightedError))
                if weightedError < minError:
                    minError = weightedError #找到最小误差
                    bestClassEst = predictedVals.copy() #最小误差对应的分类结果
                    bestStump['dim'] = i #最小误差对应的特征
                    bestStump['thresh'] = threshVal #最小误差对应的阈值
                    bestStump['ineq'] = inequal #最小误差对应的规则
    return bestStump,minError,bestClassEst
D = np.mat(np.ones((5,1))/5)
print(D)
buildStump(dataMat,classLabels,D)
[[0.2]
 [0.2]
 [0.2]
 [0.2]
 [0.2]]


({'dim': 0, 'thresh': 1.3, 'ineq': 'lt'}, matrix([[0.2]]), array([[-1.],
        [ 1.],
        [-1.],
        [-1.],
        [ 1.]]))
完整版AdaBoost算法实现
from math import *
def adaBoostTrainDS(dataArr,classLabels,numIt=40):
    weakClassArr = []
    m = np.shape(dataArr)[0]
    D = np.mat(np.ones((m,1))/m)
    aggClassEst = np.mat(np.zeros((m,1)))
    for i in range(numIt):
        #找到最佳单层决策树
        bestStump,error,classEst = buildStump(dataArr,classLabels,D)#classEst:array
#         print('D:\n',D.T)

        #更新alpha,weight
        alpha = float(0.5*log((1.0-error)/max(error,1e-16)))
        bestStump['alpha'] = alpha
        weakClassArr.append(bestStump)
#         print('classEst:\n',classEst.T)
        expon = np.multiply(-1*alpha*np.mat(classLabels).T,classEst) #matrix
        D = np.multiply(D,np.exp(expon))
        D = D/D.sum()

        #记录每个样布的评估结果,可以看到每个样本的评估都在往一个正确的方向变化
        aggClassEst += alpha*classEst
#         print('aggClassEst:\n',aggClassEst)

        #统计错误率
        aggErrors = np.multiply(np.sign(aggClassEst) != np.mat(classLabels).T,np.ones((m,1))) #统计错误个数
        errorRate = aggErrors.sum() / m#计算错误率
        print('total error:\n',errorRate)

        #若错误率为0,则停止迭代
        if errorRate == 0.0: break
    return weakClassArr,aggClassEst
classifierArray,aggClassEst = adaBoostTrainDS(dataMat,classLabels,9)
classifierArray
total error:
 0.2
total error:
 0.2
total error:
 0.0


[{'dim': 0, 'thresh': 1.3, 'ineq': 'lt', 'alpha': 0.6931471805599453},
 {'dim': 1, 'thresh': 1.0, 'ineq': 'lt', 'alpha': 0.9729550745276565},
 {'dim': 0, 'thresh': 0.9, 'ineq': 'lt', 'alpha': 0.8958797346140273}]
测试算法
def adaClassify(datToclass,classifierArr):
    dataMatrix = np.mat(datToclass)
    m = np.shape(dataMatrix)[0]
    aggClassEst = np.mat(np.zeros((m,1)))
    for i in range(len(classifierArray)): #遍历全部弱分类器
        classEst = stumpClassify(dataMatrix,classifierArr[i]['dim'],classifierArray[i]['thresh'],classifierArray[i]['ineq']) #分类结果:1,-1
        aggClassEst += classifierArray[i]['alpha']*classEst
#         print(aggClassEst)
    res =np.sign(aggClassEst)
    return res
#测试
adaClassify([0,0],classifierArray)
matrix([[-1.]])
在马疝病数据集应用AdaBoost分类器
def loadDataSet(fileName):
    fr = open(fileName)
    numFeature = len(fr.readline().strip().split('\t'))
    dataMat =[];labelMat =[]
    for line in fr.readlines():
        lineList =[]
        curLine = line.strip().split('\t')
        for i in range(numFeature-1):
            lineList.append(float(curLine[i]))
        dataMat.append(lineList)
        labelMat.append(float(curLine[-1]))
    return dataMat,labelMat
traindataMat,trainlabelMat = loadDataSet('../../Reference Code/Ch07/horseColicTraining2.txt')
testdataMat,testlabelMat = loadDataSet('../../Reference Code/Ch07/horseColicTest2.txt')
classifierArray,aggClassEst = adaBoostTrainDS(traindataMat,trainlabelMat,10)
classifierArray
total error:
 0.28523489932885904
total error:
 0.28523489932885904
total error:
 0.2483221476510067
total error:
 0.2483221476510067
total error:
 0.2483221476510067
total error:
 0.24161073825503357
total error:
 0.24161073825503357
total error:
 0.2214765100671141
total error:
 0.2483221476510067
total error:
 0.2214765100671141


[{'dim': 9, 'thresh': 3.0, 'ineq': 'gt', 'alpha': 0.4593204546095544},
 {'dim': 17, 'thresh': 52.5, 'ineq': 'gt', 'alpha': 0.31654488263333286},
 {'dim': 3,
  'thresh': 55.199999999999996,
  'ineq': 'gt',
  'alpha': 0.28402835050611847},
 {'dim': 18,
  'thresh': 62.300000000000004,
  'ineq': 'lt',
  'alpha': 0.23222873860913737},
 {'dim': 10, 'thresh': 0.0, 'ineq': 'lt', 'alpha': 0.19836267426245105},
 {'dim': 5, 'thresh': 2.0, 'ineq': 'gt', 'alpha': 0.18642416210017293},
 {'dim': 12, 'thresh': 1.2, 'ineq': 'lt', 'alpha': 0.1496988869138094},
 {'dim': 7, 'thresh': 1.2, 'ineq': 'gt', 'alpha': 0.15848275395378547},
 {'dim': 5, 'thresh': 0.0, 'ineq': 'lt', 'alpha': 0.1370746524177519},
 {'dim': 0, 'thresh': 1.0, 'ineq': 'lt', 'alpha': 0.12365372615766472}]
prediction = adaClassify(testdataMat,classifierArray)
errArr = np.ones((len(prediction),1))
errNum = errArr[prediction!=np.mat(testlabelMat).T].sum()
errRate= errNum/len(prediction)
print('错误个数:%d'%errNum)
print('错误率:%.2f'%errRate)
错误个数:15
错误率:0.23
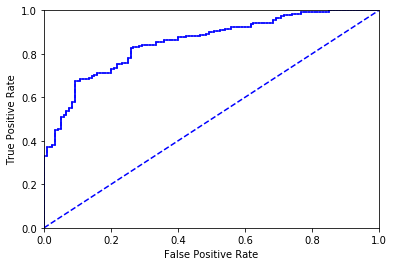
ROC曲线
def plotROC(predStrengths,classLabels):
    import matplotlib.pyplot as plt
    cur = (0.,0.)
    ySum =0.
    numPosClass = sum(np.array(classLabels)==1.0) #统计正例的数目
    yStep = 1/ float(numPosClass) #正阳率的步长
    xStep = 1/float(len(classLabels)-numPosClass) #假阳率的步长
    sortedIndicies = predStrengths.argsort() #从小到大排序,返回index
    fig = plt.figure()
#     fig.clf()
    ax = plt.subplot(111)
    #[::-1],反转,从大到小排序,即所有样例判定为反例
    for index in sortedIndicies.tolist()[0][::-1]: #tolist(),matrix 变成list,才能遍历里面的元素
        if classLabels[index] == 1.0: #若当前为正例,则正阳率增加一个步长,假阳率不变
            delX=0;delY=yStep
        else:
            delX = xStep;delY=0
            ySum+=cur[1]
        ax.plot([cur[0] , cur[0]+delX],[cur[1],cur[1]+delY],c='b')
        cur = (cur[0] + delX,cur[1] + delY) #当前样例的坐标
    ax.plot([0,1],[0,1],'b--')
    plt.xlabel('False Positive Rate')
    plt.ylabel('True Positive Rate')
    ax.axis([0,1,0,1])
    plt.show()
    print('the Area Under the Curve is :',ySum*xStep)
traindataMat,trainlabelMat = loadDataSet('../../Reference Code/Ch07/horseColicTraining2.txt')
classifierArray,aggClassEst = adaBoostTrainDS(traindataMat,trainlabelMat,10)
total error:
 0.28523489932885904
total error:
 0.28523489932885904
total error:
 0.2483221476510067
total error:
 0.2483221476510067
total error:
 0.2483221476510067
total error:
 0.24161073825503357
total error:
 0.24161073825503357
total error:
 0.2214765100671141
total error:
 0.2483221476510067
total error:
 0.2214765100671141
plotROC(aggClassEst.T,trainlabelMat) #aggClassEst.T变成一行
the Area Under the Curve is : 0.8538389513108627

