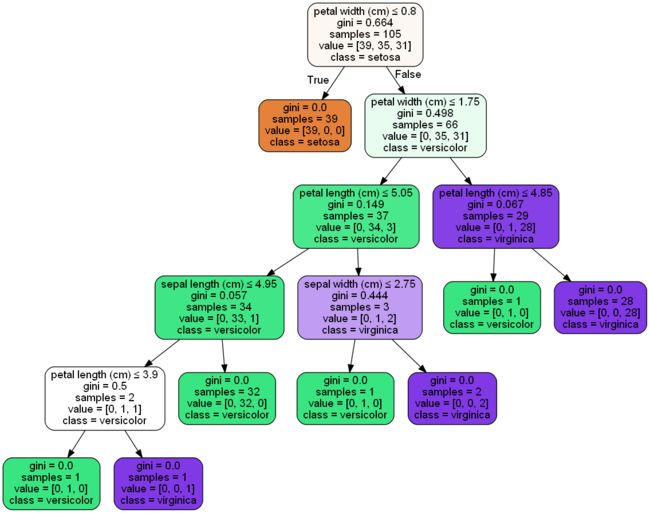
学习了决策树和逻辑回归的理论知识,决定亲自上手尝试一下。最终导出决策树的决策过程的图片和pdf。逻辑回归部分参考的是用逻辑回归实现鸢尾花数据集分类,感谢原作者xiaoyangerr
- 注意:要导出为pdf先必须安装graphviz(这是一个软件)并且安装pydotplus这个包,把它的graphviz加入系统的环境变量path,否则会报错
决策树
from sklearn.datasets import load_iris
from sklearn import tree
from sklearn.model_selection import train_test_split
# 加载数据集
iris = load_iris()
# 引入训练模型
clf = tree.DecisionTreeClassifier()
X = iris.data
y = iris.target
# 分割数据集
X_train,X_test,y_train,y_test = train_test_split(X,y,test_size=0.3,random_state=33)
# 开始训练
clf.fit(X_train,y_train)
# 预测
y_predict=clf.predict(X_test)
from sklearn.metrics import classification_report
#显示预测的准确性
# X : array-like, shape = (n_samples, n_features)
#        Test samples.
#    y : array-like, shape = (n_samples) or (n_samples, n_outputs)
#        True labels for X.

print(clf.score(X_test,y_test))# 输出结果为0.9111111111111111
print(classification_report(y_predict,y_test))
# 输出结果为
'''
  precision    recall  f1-score   support

          0       1.00      1.00      1.00        11
          1       1.00      0.79      0.88        19
          2       0.79      1.00      0.88        15

avg / total       0.93      0.91      0.91        45
'''
# 导出为pdf
import pydotplus
dot_data = tree.export_graphviz(clf,out_file=None)
graph = pydotplus.graph_from_dot_data(dot_data)
graph.write_pdf('iris.pdf')
#导出为图片
from IPython.display import Image
dot_data = tree.export_graphviz(clf, out_file=None,
feature_names=iris.feature_names, class_names=iris.target_names,filled=True, rounded=True,special_characters=True)
-
决策过程
逻辑回归
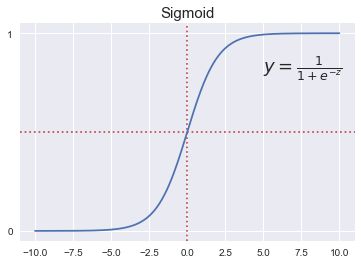
- 函数图像
# 图象
x = np.linspace(-10,10,1000)
y = 1/(1+np.exp(-x))
sns.set()
plt.axhline(0.5,color='r',ls='dotted')
plt.axvline(0,color='r',ls = 'dotted')
plt.yticks([0.0,5,1.0])
plt.title(r'Sigmoid', fontsize = 15)
plt.text(5,0.8,r'$y = \frac{1}{1+e^{-z}}$', fontsize = 18)
plt.plot(x,y)
- 数据分析
import pandas as pd
import numpy as np
import matplotlib.pyplot as plt
import plotly.plotly as py
import plotly.graph_objs as go
from sklearn.decomposition import PCA

from plotly.offline import init_notebook_mode, iplot
init_notebook_mode(connected = True)
data = pd.read_csv('http://archive.ics.uci.edu/ml/machine-learning-databases/iris/iris.data',header=None)
data.columns = ['Sepal.Length','Sepal.Width','Petal.Length','Petal.Width','Species']
data.head()
'''
输出为:
Sepal.Length    Sepal.Width Petal.Length    Petal.Width Species
0   5.1 3.5 1.4 0.2 Iris-setosa
1   4.9 3.0 1.4 0.2 Iris-setosa
2   4.7 3.2 1.3 0.2 Iris-setosa
3   4.6 3.1 1.5 0.2 Iris-setosa
4   5.0 3.6 1.4 0.2 Iris-setosa
'''
labels = data.groupby('Species').size().index
values = data.groupby('Species').size()
trace = go.Pie(labels=labels, values=values)
layout = go.Layout(width=500, height=500)
fig = go.Figure(data=[trace], layout=layout)
iplot(fig)
输出为:
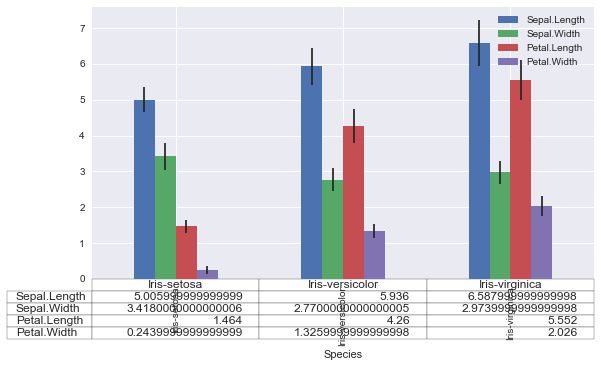
groups= data.groupby(by="Species")
means,sds = groups.mean(),groups.std()
means.plot(yerr=sds,kind='bar',figsize=(9,5),table=True)
plt.show()
输出为:
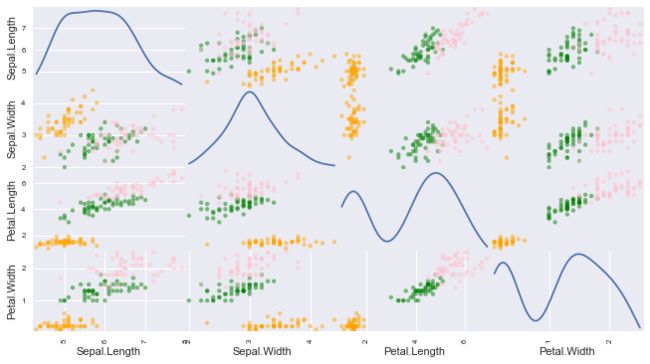
col_map = {'Iris-setosa': 'orange', 'Iris-versicolor': 'green', 'Iris-virginica': 'pink'}
pd.tools.plotting.scatter_matrix(data.loc[:, 'Sepal.Length':'Petal.Width']
, diagonal = 'kde', color = [col_map[lb] for lb in data['Species']], s = 75, figsize = (11, 6))
plt.show()
输出为:
- 正式开始处理
from sklearn.datasets import load_iris
import matplotlib.pyplot as plt
iris = load_iris()
print("Iris Dataset contains %s samples in total,%s features."%(iris.data.shape[0], iris.data.shape[1]))# 输出为Iris Dataset contains 150 samples in total,4 features.
'''
iris.data[:5]
array([[5.1, 3.5, 1.4, 0.2],
       [4.9, 3. , 1.4, 0.2],
       [4.7, 3.2, 1.3, 0.2],
       [4.6, 3.1, 1.5, 0.2],
       [5. , 3.6, 1.4, 0.2]])
iris.target
array([0, 0, 0, 0, 0, 0, 0, 0, 0, 0, 0, 0, 0, 0, 0, 0, 0, 0, 0, 0, 0, 0,
       0, 0, 0, 0, 0, 0, 0, 0, 0, 0, 0, 0, 0, 0, 0, 0, 0, 0, 0, 0, 0, 0,
       0, 0, 0, 0, 0, 0, 1, 1, 1, 1, 1, 1, 1, 1, 1, 1, 1, 1, 1, 1, 1, 1,
       1, 1, 1, 1, 1, 1, 1, 1, 1, 1, 1, 1, 1, 1, 1, 1, 1, 1, 1, 1, 1, 1,
       1, 1, 1, 1, 1, 1, 1, 1, 1, 1, 1, 1, 2, 2, 2, 2, 2, 2, 2, 2, 2, 2,
       2, 2, 2, 2, 2, 2, 2, 2, 2, 2, 2, 2, 2, 2, 2, 2, 2, 2, 2, 2, 2, 2,
       2, 2, 2, 2, 2, 2, 2, 2, 2, 2, 2, 2, 2, 2, 2, 2, 2, 2])
'''
from sklearn.model_selection import train_test_split
X = iris.data[:,:2]
Y = iris.target
x_train, x_test, y_train, y_test = train_test_split(X,Y, test_size = 0.3, random_state = 0)
from sklearn.linear_model import LogisticRegression
lr = LogisticRegression(penalty='l2',solver='newton-cg',multi_class='multinomial')
lr.fit(x_train,y_train)
print("Logistic Regression模型训练集的准确率:%.3f" %lr.score(x_train, y_train))# Logistic Regression模型训练集的准确率:0.829
print("Logistic Regression模型测试集的准确率:%.3f" %lr.score(x_test, y_test))# Logistic Regression模型测试集的准确率:0.822
target_names = ['setosa', 'versicolor', 'virginica']
print(metrics.classification_report(y_test, y_hat, target_names = target_names))
'''
输出为:
precision    recall  f1-score   support

     setosa       1.00      1.00      1.00        16
 versicolor       0.81      0.72      0.76        18
  virginica       0.62      0.73      0.67        11

avg / total       0.83      0.82      0.82        45
'''


