点,线,面,文字符号JSON定义
1.环境说明
ArcGIS 10.4.1
JS API 3.15
2.以JSON参数构建符号介绍
在ArcGIS JS API中,提供了三种方式构建点、线、面、文字符号:
(1)使用无参数的构造函数,然后在逐一设置属性。以点符号定义为例:
var sms=new SimpleMarkerSymbol();
sms.setStyle("circle");
sms.setSize(12);
sms.setOutline(null);
sms.setColor(newColor([255,0,0]));
(2)使用含参数的构造函数,直接传入各属性。
var sms=new SimpleMarkerSymbol("circle",12,null,newColor([255,0,0]));
(3)使用JSON参数的构造函数。
var sms=new SimpleMarkerSymbol(jsonObject);
即将所有属性定义成JSON格式。这样做的好处,不用预先引入参数所需要的类文件,而且代码更加简洁,这也是ArcGIS
JS API 4.x版本主推的构建方式。
3.各符号的JSON定义格式
在JS API帮助中可以查询到部分符号的JSON定义格式,对于没有给出的部分,可以先按第一种或者第二种方法定义符号,再调用符号的toJson()方法输出得到JSON格式定义。
(1)无边框的SimpleMarkerSymbol
{
"color": [255, 0, 0],
"size": 12,
"type": "esriSMS",
"style": "esriSMSCircle"
}
(2)有边框的SimpleMarkerSymbol
{
"color": [255, 0, 0],
"size": 12,
"type": "esriSMS",
"style": "esriSMSCircle",
"outline": {
"color":[255, 0, 0],
"width":1,
"type":"esriSLS",
"style":"esriSLSSolid"
}
}
(3)PictureMarkerSymbol
{
"url":"graphics/redArrow2.png",
"height":20,
"width":20,
"type":"esriPMS"
}
(4)SimpleLineSymbol
{
"color":[255, 0, 0],
"width":1,
"type":"esriSLS",
"style":"esriSLSSolid"
}
(5)无边框的SimpleFillSymbol
{
"color": [255, 0, 0, 128],
"type": "esriSFS",
"style": "esriSFSSolid"
}
(6)有边框的SimpleFillSymbol
{
"color": [255, 0, 0, 128],
"type": "esriSFS",
"style": "esriSFSSolid",
"outline": {
"color": [0, 0, 0, 255],
"width": 1,
"type": "esriSLS",
"style": "esriSLSSolid"
}
}
注:style类型可参考API帮助中的style定义类型。color不支持十六进制值。
4.JSON构建符号测试
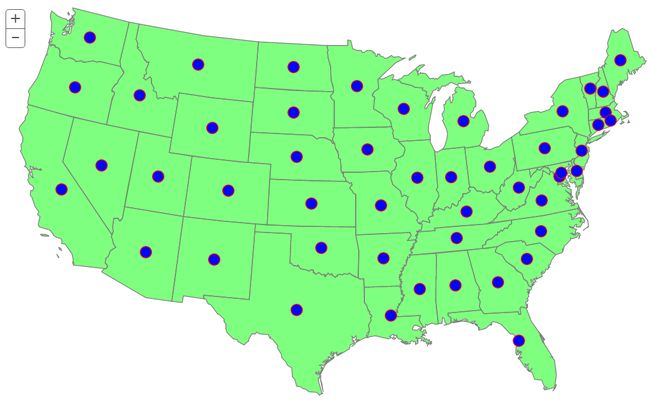
//点符号
var sms=new SimpleMarkerSymbol({
"color": [0,0,255],
"size":14,
"type":"esriSMS",
"style":"esriSMSCircle",
"outline": {
"color":[255,0,0],
"width":1,
"type":"esriSLS",
"style":"esriSLSSolid"}
});
//面符号
var sfs=new SimpleFillSymbol({
"color": [0,255,0,128],
"type":"esriSFS",
"style":"esriSFSSolid",
"outline": {
"color": [128,128,128,255],
"width":1,
"type":"esriSLS",
"style":"esriSLSSolid"}
});
var citiesRenderer=new SimpleRenderer(sms);
var statesRenderer=new SimpleRenderer(sfs);
var statesUrl="https://sampleserver6.arcgisonline.com/arcgis/rest/services/USA /MapServer/2";
var states=new FeatureLayer(statesUrl);
states.setRenderer(statesRenderer);
map.addLayer(states);
var citiesUrl="https://sampleserver6.arcgisonline.com/arcgis/rest/services/USA/MapServer/2";
var citiesLayer=new FeatureLayer(citiesUrl);
citiesLayer.setRenderer(citiesRenderer);
map.addLayer(citiesLayer);
效果:
5.源码
JSON构建地图渲染
