GUI 笔记
GUI 笔记
学习10分钟学MATLAB/ GUI总结
- get:获得某对象属性
- set:设置某对象属性
- findobj:寻找符合属性要求的对象
- allchild:寻找某一对象的子对象
%界面->变颜色的曲线
clear;clc;close all
h = figure('Units','Normalized', ...
    'Position', [0.2 0.2 0.5 0.5],...
    'Menu', 'none');
ha = axes('Parent', h, 'Units', 'Normalized', ...
    'Position', [0.1 0.1 0.8 0.8]);
hl = line('Parent', ha, 'XData', [0:0.1:6], ...
    'YData', sin([0:0.1:6]), 'Color', 'r');
cstring = 'gbkmy';

for k=1:5
    set(hl, 'Color', cstring(k));
    pause(3);
end
- Figure
- Axes
- Line
- Text
- Uicontrol
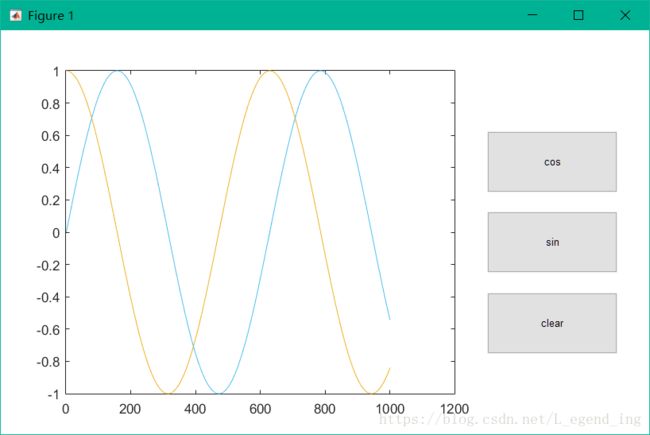
hf = figure(...
    'Units', 'Normalized', ...
    'Menu', 'none', ...
    'Color', 'w', ...
    'Position', [0.1 0.1 0.7 0.5]);
ha = axes(...
    'Parent', hf, ...
    'Units', 'Normalized', ...
    'Position', [0.1 0.1 0.6 0.8], ...
    'NextPlot', 'Add', ...
    'Box', 'on');
hb1 = uicontrol(...
    'Style', 'pushbutton', ...
    'Callback', 'try, delete(allchild(ha));end', ...
    'String', 'clear', ...
    'Units', 'Normalized', ...
    'Position', [0.75 0.2 0.2 0.15]);
hb2 = uicontrol(...
    'Style', 'pushbutton', ...
    'Callback', 'plot(sin([0:0.01:10]));', ...
    'String', 'sin', ...
    'Units', 'Normalized', ...
    'Position', [0.75 0.4 0.2 0.15]);
hb3 = uicontrol(...
    'Style', 'pushbutton', ...
    'Callback', 'plot(cos([0:0.01:10]));', ...
    'String', 'cos', ...
    'Units', 'Normalized', ...
    'Position', [0.75 0.6 0.2 0.15])
