吴恩达机器学习课后习题ex1
import numpy as np
import pandas as pd
import matplotlib.pyplot as plt
二:读取数据
path = 'ex1data1.txt'
data = pd.read_csv(path,header = 0,names = ['Population','Profit'])
data.tail()
| Population | Profit | |
|---|---|---|
| 91 | 5.8707 | 7.20290 |
| 92 | 5.3054 | 1.98690 |
| 93 | 8.2934 | 0.14454 |
| 94 | 13.3940 | 9.05510 |
| 95 | 5.4369 | 0.61705 |
三:数据可视化
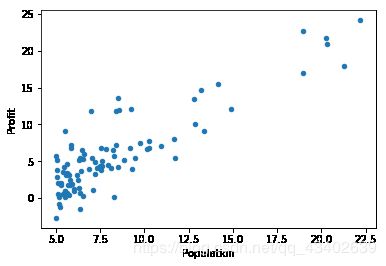
data.plot(kind='scatter',x='Population',y='Profit')
plt.show()
四:数据处理
data.insert(0,'Ones',1)
cols = data.shape[1]#二维:[0]行,[1]列
x = data.iloc[:,:cols-1] #保留前两列 'Ones','population'
y = data.iloc[:,cols-1:cols]#最后一列,本例即profit
#这里把x,y 理解成DataFrame
x = np.array(x.values) #重新生成一个矩阵
y = np.array(y.values)
theta = np.array([0,0]).reshape(1,2)#theta是个行向量
pandas的iloc,loc用法 https://blog.csdn.net/missyougoon/article/details/83375375
五:计算代价函数
def compute_cost(x,y,theta):
    inner = np.power(np.dot(x,theta.T) - y, 2)#power求次方,dot矩阵相乘
    return sum(inner)/(2*len(x)) #???
dot方法:矩阵相乘 https://www.cnblogs.com/luhuan/p/7925790.html
六:梯度下降算法(参考资料:https://www.cnblogs.com/ooon/p/4947688.html)
parameters = int(theta.shape[1]) #参数数量
#parameters = int(theta.flatten().shape[0])
alpha = 0.01 #相关参数
epoch = 100  #定义迭代次数
def gradientDescent(x, y, theta, alpha, epoch = 1000):
    temp = np.array(np.zeros(theta.shape)) #初始化参数矩阵
    #parameters = int(theta.shape[1]) #参数数量
    cost = np.zeros(epoch) #初始化一个ndarray,包含每次更新后的代价
    m = x.shape[0] #样本数目

    for i in range(epoch):
        temp = theta - (alpha/m)*(x.dot(theta.T)-y).T.dot(x)
        theta = temp #同步更新theta
        cost[i] = compute_cost(x,y,theta)
    return theta,cost
np.flatten()降维 https://www.cnblogs.com/yvonnes/p/10020926.html
final_theta, cost = gradientDescent(x,y,theta,alpha,epoch)
final_cost = compute_cost(x,y,final_theta)
population = np.linspace(data.Population.min(),data.Population.max(),97)
#返回人口数一维矩阵顺序从小到大
np.linspace;
https://blog.csdn.net/you_are_my_dream/article/details/53493752
population = np.linspace(data.Population.min(), data.Population.max(), 100)
profit = final_theta[0,0] + (final_theta[0,1] * population)

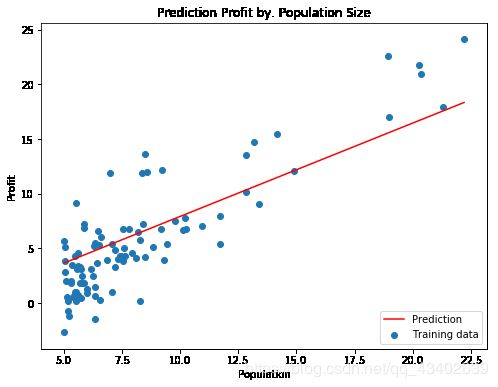
fig, ax = plt.subplots(figsize=(8, 6))
ax.plot(population, profit, 'r', label='Prediction')#最小损失直线
ax.scatter(data['Population'], data['Profit'], label='Training data')#散点
ax.legend(loc=4) # 4表示标签在右下角
ax.set_xlabel('Population')
ax.set_ylabel('Profit')
ax.set_title('Prediction Profit by. Population Size')
plt.show()
plt.subplots介绍:
https://blog.csdn.net/qq_39622065/article/details/82909421
参考学习文章:
https://blog.csdn.net/Mrs_Ivory/article/details/91449797
数据ex1data.txt:
6.1101,17.592
5.5277,9.1302
8.5186,13.662
7.0032,11.854
5.8598,6.8233
8.3829,11.886
7.4764,4.3483
8.5781,12
6.4862,6.5987
5.0546,3.8166
5.7107,3.2522
14.164,15.505
5.734,3.1551
8.4084,7.2258
5.6407,0.71618
5.3794,3.5129
6.3654,5.3048
5.1301,0.56077
6.4296,3.6518
7.0708,5.3893
6.1891,3.1386
20.27,21.767
5.4901,4.263
6.3261,5.1875
5.5649,3.0825
18.945,22.638
12.828,13.501
10.957,7.0467
13.176,14.692
22.203,24.147
5.2524,-1.22
6.5894,5.9966
9.2482,12.134
5.8918,1.8495
8.2111,6.5426
7.9334,4.5623
8.0959,4.1164
5.6063,3.3928
12.836,10.117
6.3534,5.4974
5.4069,0.55657
6.8825,3.9115
11.708,5.3854
5.7737,2.4406
7.8247,6.7318
7.0931,1.0463
5.0702,5.1337
5.8014,1.844
11.7,8.0043
5.5416,1.0179
7.5402,6.7504
5.3077,1.8396
7.4239,4.2885
7.6031,4.9981
6.3328,1.4233
6.3589,-1.4211
6.2742,2.4756
5.6397,4.6042
9.3102,3.9624
9.4536,5.4141
8.8254,5.1694
5.1793,-0.74279
21.279,17.929
14.908,12.054
18.959,17.054
7.2182,4.8852
8.2951,5.7442
10.236,7.7754
5.4994,1.0173
20.341,20.992
10.136,6.6799
7.3345,4.0259
6.0062,1.2784
7.2259,3.3411
5.0269,-2.6807
6.5479,0.29678
7.5386,3.8845
5.0365,5.7014
10.274,6.7526
5.1077,2.0576
5.7292,0.47953
5.1884,0.20421
6.3557,0.67861
9.7687,7.5435
6.5159,5.3436
8.5172,4.2415
9.1802,6.7981
6.002,0.92695
5.5204,0.152
5.0594,2.8214
5.7077,1.8451
7.6366,4.2959
5.8707,7.2029
5.3054,1.9869
8.2934,0.14454
13.394,9.0551
5.4369,0.61705
7/12记录
今天在一本书上看到另外一种直接调用scipy.polyfit自动拟合函数模型的实现方法,觉得很有趣儿,补充。
import numpy as np
import pandas as pd
import matplotlib.pyplot as plt
import scipy as sp

path = 'ex1data1.txt'
data = pd.read_csv(path,header = 0,names = ['Population','Profit'])
data.tail()
x = data.iloc[:,:1]
y = data.iloc[:,1:]
x = np.array(x.values)	#populartion
y = np.array(y.values)	#profit
x = x.flatten()	#降维
y = y.flatten()
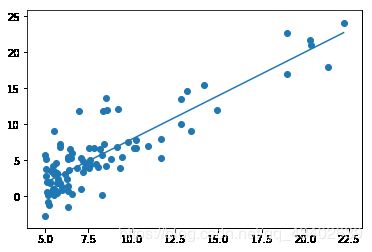
fp1,residuals,rank,sv,rcond = sp.polyfit(x,y,1,full=True)
f1 = sp.poly1d(fp1)
population = np.linspace(data.Population.min(), data.Population.max(), 100)
plt.plot(population,f1(population))
plt.scatter(x,y)
plt.show()
def error(f,x,y):
    return sp.sum((f(x)-y)**2)
梯度下降算法:
最后参数和计算误差:

scipy.polyfit自动拟合函数模型的方法:
最后参数和计算误差:

其实我内心是怀疑的,这直线向下拟合会到-4多???欺负我视力不好?
然后我调整将坐标从-5开始,
然后。。。


