import numpy as np
import pandas as pd
import matplotlib.pyplot as plt
1.读取数据
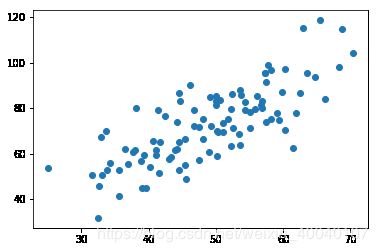
train = np.genfromtxt('data.csv', delimiter=',')
X = train[:, 0]
y = train[:, 1]
plt.scatter(X, y)
plt.show()
2.定义损失函数
- 拟合函数

- 损失函数
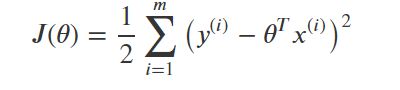
def loss_function(w, b, train):
total_cost = 0.0
M = len(train)
for i in range(M):
x = train[i,0]
y = train[i,1]
total_cost += (y - w * x - b) ** 2
return total_cost / (2 * M)
3.定义模型的超参数
alpha = 0.0001
init_w = 0
init_b = 0
num_iter = 10
4.使用梯度下降计算参数
- 求导公式

def grad_desc(train, init_w, init_b, alpha, num_iter):
w = init_w
b = init_b
cost_values = []
for i in range(num_iter):
cost_values.append(loss_function(w, b, train))
w, b = setp_grad_desc(train, w, b, alpha)
return [w, b, cost_values]
def setp_grad_desc(train, current_w, current_b, alpha):
sum_grad_w = 0
sum_grad_b = 0
M = len(train)
for i in range(M):
x = train[i,0]
y = train[i,1]
sum_grad_w += (current_w * x + current_b - y) * x
sum_grad_b += current_w * x + current_b - y
grad_w = sum_grad_w / M
grad_b = sum_grad_b / M
update_w = current_w - alpha * grad_w
update_b = current_b - alpha * grad_b
return update_w, update_b
w, b, cost_values= grad_desc(train, init_w, init_b, alpha, num_iter)
print("w is :" , w)
print("b is :" , b)
cost = loss_function(w, b, train)
print("cost is :" , cost)
plt.plot(cost_values)
plt.show()
w is : 1.394730441275591
b is : 0.027713586724842688
cost is : 130.31761996260104

5.画出拟合曲线
x = train[:,0]
y = train[:,1]
plt.scatter(x, y)
pre_y = w * x + b
plt.plot(x, pre_y , color='r')
