R数据分析——时间序列管理
一、时间序列分析包------forecast、tseries、TTR
??forecast
??tseries
??TTR使用默认S3方法:
forecast(object,...)
时间序列(time series,ts)的S3方法
forecast(object,h=ifelse(frequency(object) > 1,2 * frequency(object),10),
level=c(80,95),fan=FALSE,lambda=NULL,find.frequency=FALSE,allow.multiplicative.trend=FALSE,model=NULL,...)
相关参数
object---------------------需要预测的时间序列或时间序列模型;如果模型= NULL,则根据时间序列的频率,预测ts会将这些值传递给ets或stlf。如果模型不是NULL,参数将传递给相关的建模函数。
h---------------------------预测期间数;
level-----------------------预测间隔的置信水平;
fan-------------------------如果为TRUE,则级别设置为seq ( 51,99,by = 3 )。这适用于扇形图;
robust----------------------如果为TRUE,则该函数对对象中的缺失值和异常值具有鲁棒性。只有当对象属于类ts时,此参数才有效;
λ---------------------------Box-Cox变换参数;
find . frequency-------------如果为TRUE,则如果数据的周期未知,则函数将确定适当的周期;
allow.multiplicative.trend---如果为真,则允许具有乘法趋势的ETS模型。否则,只允许添加或不允许趋势ETS模型;
model-------------------------描述时间序列模型的对象:例如ets类、Arima类、蝙蝠类、tbats类或nnetar类中的一种;
返回“预测”类对象的其他函数有:
forecast.ets, forecast.Arima, forecast.HoltWinters, forecast.StructTS, meanf, rwf, splinef, thetaf, croston, ses, holt, hw.
指数平滑预测
返回应用于y的指数平滑预测的预测和其他信息。
ses(y, h = 10, level = c(80, 95), fan = FALSE, initial = c("optimal", "simple"), alpha = NULL, lambda = NULL, biasadj = FALSE, x = y, ...)holt(y, h = 10, damped = FALSE, level = c(80, 95), fan = FALSE, initial = c("optimal", "simple"), exponential = FALSE, alpha = NULL, beta = NULL, phi = NULL, lambda = NULL, biasadj = FALSE, x = y, ...)hw(y, h = 2 * frequency(x), seasonal = c("additive", "multiplicative"), damped = FALSE, level = c(80, 95), fan = FALSE, initial = c("optimal", "simple"), exponential = FALSE, alpha = NULL, beta = NULL, gamma = NULL, phi = NULL, lambda = NULL, biasadj = FALSE, x = y,)ses、Holt和HW是用于预测的简单方便的包装函数(ets(...))。
参数
y----------类别ts的数字向量或时间序列;
initial------用于选择初始状态值的方法。如果是最优的,则使用ets连同平滑参数一起优化初始值。如果简单,则初始值设置为使用对前几个观测值的简单计算获得的值。有关详细信息,请参见海曼和阿萨那普洛斯( 2014年);
alpha-------高程的平滑参数值。如果为空,则进行估计;
λ----------co-box变换参数。如果为空则忽略。否则,在模型估计之前变换数据。当λ= TRUE时,加法运算仅设置为FALSE;
biasadj------对Box - Cox转换使用调整后的反向转换平均值。如果为TRUE,则点预测和拟合值为平均预测。否则,这些点可视为预测密度的中值;
...----------传递给预测的其他参数damped——如果为TRUE,则使用阻尼趋势;
exponential---如果为TRUE则拟合指数趋势。否则,趋势是(局部)线性的;
β -----------趋势的平滑参数值。如果为空,则进行估计;
φ------------阻尼参数值(如果阻尼=真)。如果为空,则进行估计;
seasonal------硬件模型中的季节性类型。“加法”或“乘法”;
gamma---------季节组件的平滑参数值。如果为空,则进行估计;
均值预测
用于返回应用于y的iid模型的预测和预测间隔meanf(y, h = 10, level = c(80, 95), fan = FALSE, lambda = NULL,
biasadj = FALSE, x = y)参数
y----类别ts的数字向量或时间序列h----预测期间数
漂移模型的随机行走是
Y[t]=mu+Z[t]
其中Z[t]是正常的iid误差。预测通过下面公式给出:
Y[n+h]=mu
给出其中mu是样本均值估计。
如果没有漂移(如在naive中),则漂移参数c = 0。预测标准误差允许估计漂移参数的不确定性。
季节性朴素模型是:
Y[t]=Y[t-m] + Z[t]
其中Z [ t ]是正常的iid误差。
第二部分 时间序列应用的模型和基础知识
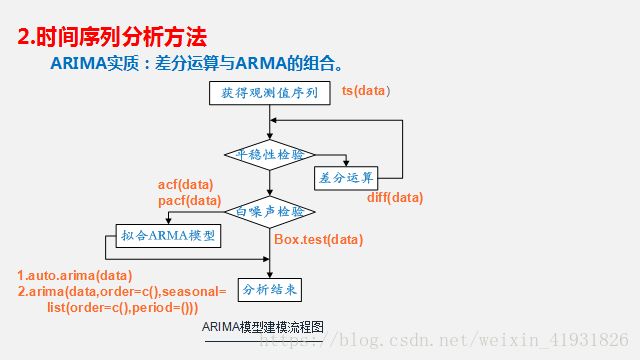
2.1.自回归求和移动平均模型( Augogressive Integrated Moving Average,ARIMA)
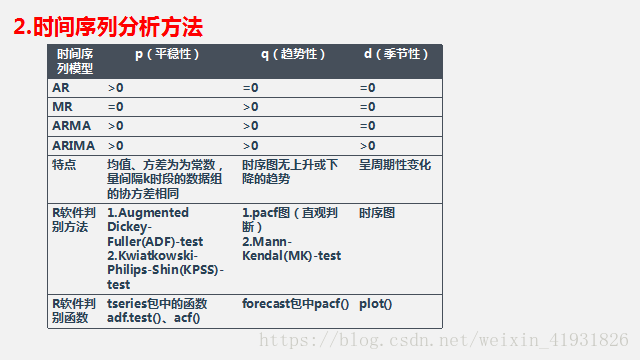
在ARIMA模型中,AR代表自回归(平稳时间序列),AR(p),MA代表移动平均(以零居中的时间序列),MA(q):q阶移动平均模型。p=0以及q!=0,ARMA(p,q)模型简化成AR(p)模型,p=0,q!=0则ARMA(p,q)简化成MA(q)模型。由于AR与MA都要求时间序列为稳定序列,可以把它们结合到一个模型中—ARMA模型。不平稳的时间序列会随时间呈现一个趋势,从而不满足固定期望值(均值)的要求,可以调整数据来移除这种趋势。
方法有:1)对时间序列执行回归分析,然后从每个观察到的y值中减去拟合回归线的值。2)计算连续y值之间的差异—差分法。可差分多次得到平稳序列,弹药避免过度差分。查分用d表示,则得到模型ARMA(p,q,d),另外,需要考虑时间序列中的季节效应,则ARMA模型拓展为季节自回归求和移动平均模型ARIMA(p,q,d)x(P,Q,D)s.其中P:AR中项(item)在时段上的数量;D:S时段上差异的数量;Q:MA中项(item)在s时段上的数量。s的值:52是周数据;12是月数据;7是周数据。
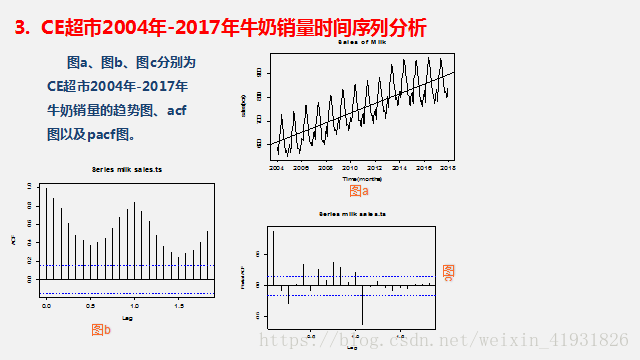
2.2自相关函数ACF值介于{-1,1}之间,ACF(0)=1。所以ACF值越接近1,则时间序列越能作为预测值得有效预测。(可以取ACF>0.6的时间序列)。部分自相关函数(PACF)与ACF描述类似。
第三部分—案例分析
参考文章有:
1.用R分析实例数据http://www.cnblogs.com/sylvanas2012/p/4328861.html。
训练数据下载地址:https://datamarket.com/data/list/?q=provider:tsdl
数据包:AirPassenger
2.其他数据包下载网站: https://www.sogou.com/linkurl=BluioFHAuoFyJDXdb8U6ARle0CAZhm9iC1jaD4xhhQysWSmDEXmyx7bAp6VRqT6Q
passenger = read.csv('passenger.csv',header=F,sep=' ')

p<-unlist(passenger)

library("forecast")
plot(pt)
train<-window(pt,start=2001,end=2011+11/12) #window取子集
test<-window(pt,start=2012)
library(forecast)
pred_meanf<-meanf(train,h=12)
rmse(test,pred_meanf$mean) #226.2657 RMSE rootmean square error均方根误差,也叫 标准误差,近似总体均方根误差( RMSEA )的置信区间。http://127.0.0.1:15268/library/ModelMetrics/html/rmse.htmlpred_naive<-naive(train,h=12) #naive ( )只是rwf ( )的包装器,与下诉两个参见http://127.0.0.1:15268/library/forecast/html/rwf.html
rmse(pred_naive$mean,test)#102.9765
pred_snaive<-snaive(train,h=12)
rmse(pred_snaive$mean,test)#50.70832, snaive ( )返回来自ARIMA ( 0,0,0 ) ( 0,1,0 ) m模型的预测和预测间隔,其中m是季节周期。
pred_rwf<-rwf(train,h=12, drift=T) #rwf ( )返回对y应用漂移模型的随机行走的预测和预测间隔。这等效于具有可选漂移系数的ARIMA ( 0,1,0 )模型。
rmse(pred_rwf$mean,test)#92.66636
pred_ses <- ses(train,h=12,initial='simple',alpha=0.2) #指数平滑预测,返回应用于y的指数平滑预测的预测和其他信息http://127.0.0.1:15268/library/forecast/html/ses.htmlrmse(pred_ses$mean,test) #89.77035
pred_holt<-holt(train,h=12,damped=F,initial="simple",beta=0.65) #等同于ses、hw的用法http://127.0.0.1:15268/library/forecast/html/ses.html
rmse(pred_holt$mean,test)#76.86677 without beta=0.65 it would be 84.41239
pred_hw<-hw(train,h=12,seasonal='multiplicative')
rmse(pred_hw$mean,test)#16.36156
#alpha不指定,beta=不指定,gamma不指定 三阶指数平滑 seasonal="additive"默认加法模型 "multiplicative"乘法模型
rp=HoltWinters(a,beta=F,gamma=F) #利用霍尔特-温特斯对象进行预测,返回单变量Holt - Winters时间序列模型http://127.0.0.1:15268/library/forecast/html/forecast.HoltWinters.html的预测和其他信息。
tmp=rp$coefficients
forecast(rp,h=2)
fit<-ets(train)#返回用于拟合模型的数据的h步预测
accuracy(predict(fit,12),test) #24.390252
pred_stlf<-stlf(train)
rmse(pred_stlf$mean,test)#22.07215
STL分解
ts1=c(c(1:7),c(1:7),c(1:7))
ts1=ts(ts1,frequency=7,start=c(1,1))
library(forecast)
pre<-stlf(ts1)
#预测未来3个值
p=forecast(pre,h=3) #用于显示和分析单变量时间序列预测的方法和工具,包括通过状态空间模型和自动ARIMA模型的指数平滑。plot(stl(train,s.window="periodic")) #Seasonal Decomposition of Time Series by Loess
fit<-auto.arima(train) accuracy(forecast(fit,h=12),test) #23.538735

ma = arima(train, order = c(0, 1, 3), seasonal=list(order=c(0,1,3), period=12))

p<-predict(ma,12) accuracy(p$pred,test) #18.55567, BT = Box.test(ma$residuals, lag=30, type = "Ljung-Box", fitdf=2) #计算
Box - Pierce或Ljung - Box检验统计量,以检验给定时间序列中的零独立性假设。这些测试有时称为“portmantau”测试。这些检验有时应用于来自ARMA ( p,q )拟合的残差,在这种情况下,建议通过设置fitdf = p + q来获得对零假设分布的更好近似,当然前提是滞后> fitdf。http://127.0.0.1:15268/library/stats/html/Box.test.html
wape = function(pred,test)
{
        len<-length(pred)
    errSum<-sum(abs(pred[1:len]-test[1:len]))
    corSum<-sum(test[1:len])
    result<-errSum/corSum
    result
}


mae = function(pred,test)
{
    errSum<-mean(abs(pred-test))
    errSum
} #绝对平均误差


rmse = function(pred,test)
{
    res<- sqrt(mean((pred-test)^2) )
    res
}代码来源:https://github.com/MorrayTang2010/Practices/blob/master/Timesrices.r
| #ARIMA: Example1 | |
| library(tseries) | |
| library(zoo) | |
| library(forecast) | |
| air <- AirPassengers | |
| ts.plot(air) | |
| acf(air) | |
| pacf(air) | |
| x<-decompose(air) | |
| plot(x) | |
| plot(x$seasonal) | |
| air.fit <- arima(air,order=c(0,1,1), seasonal=list(order=c(0,1,1), period=12)) | |
| tsdiag(air.fit) | |
| air.forecast <- forecast(air.fit,12) | |
| plot.forecast(air.forecast) | |
| ##ARIMA: Example2 | |
| require(RJSONIO) | |
| require(WDI) | |
| require(ggplot2) | |
| require(scales) | |
| require(useful) | |
| require(zoo) | |
| require(Matrix) | |
| require(forecast) | |
| #pull the data | |
| gdp<-WDI(country=c("US","CA","GB","DE","CN","JP","SG","IL"), | |
| indicator=c("NY.GDP.PCAP.CD","NY.GDP.MKTP.CD"), | |
| start=1960,end=2011) | |
| names(gdp)<-c("iso2c","Country","Year","PerCapGDP","GDP") | |
| ggplot(gdp,aes(Year,PerCapGDP,color=Country,linetype=Country))+geom_line()+scale_y_continuous(label=dollar) | |
| ggplot(gdp,aes(Year,GDP,color=Country,lineetype=Country))+geom_line()+scale_y_continuous(label=multiple_format(extra=dollar,multiple="M")) | |
| us<-gdp$PerCapGDP[gdp$Country=="United States"] | |
| us<-ts(us,start=min(gdp$Year),end=max(gdp$Year)) | |
| plot(us,ylab="Per Capita GDP",xlab="Year") | |
| acf(us) | |
| pacf(us) | |
| ndiffs(x=us) | |
| plot(diff(us,2)) | |
| #arima | |
| usBest<-auto.arima(x=us) | |
| acf(usBest$residuals) | |
| pacf(usBest$residuals) | |
| par(mfrow=c(2,1)) | |
| pacf(us) | |
| pacf(usBest$residuals) | |
| #系数 | |
| coef(usBest) | |
| #预测 | |
| predict(usBest,n.ahead=5,se.fit=TRUE) | |
| theForecast<-forecast(object=usBest,n=5) | |
| plot(theForecast) | |
| ##Example3: VAR | |
| require(reshape2) | |
| gdpCast<-dcast(Year ~ Country,data=gdp[,c("Country","Year","PerCapGDP")], | |
| value.var="PerCapGDP") | |
| gdpTS<-ts(data=gdpCast[,-1],start=min(gdpCast$Year),end=max(gdpCast$Year)) | |
| #不同曲线画在同一图上 | |
| plot(gdpTS,plot.type="single",col=1:8) | |
| legend("topleft",legend=colnames(gdpTS),ncol=2,lty=1,col=1:8,cex=.6) | |
| #NA procession | |
| gdpTS<-gdpTS[,which(colnames(gdpTS)!="Germany")] | |
| numDiffs<-ndiffs(gdpTS) | |
| gdpDiffed<-diff(gdpTS,differences=numDiffs) | |
| dim(gdpDiffed) | |
| plot(gdpDiffed,plot.type="single",col=1:7) | |
| legend("bottomleft",legend=colnames(gdpDiffed),ncol=2,lty=1,col=1:7,cex=0.6) | |
| #VAR | |
| require(MASS) | |
| require(strucchange) | |
| require(lmtest) | |
| require(sandwich) | |
| require(urca) | |
| require(vars) | |
| require(coefplot) | |
| gdpVar<-VAR(gdpDiffed,lag.max=12) | |
| gdpVar$p | |
| gdpVar$type | |
| names(gdpVar$varresult) | |
| class(gdpVar$varresult$Canada) | |
| plot(gdpVar$varresult$Canada) | |
| head(coef(gdpVar$varresult$Canada)) | |
| coefplot(gdpVar$varresult$Canada) | |
| #predict | |
| predict(gdpVar,n.ahead=5) | |
| #Example4: ARIMA | |
| wape = function(pred,test) | |
| { | |
| len<-length(pred) | |
| errSum<-sum(abs(pred[1:len]-test[1:len])) | |
| corSum<-sum(test[1:len]) | |
| result<-errSum/corSum | |
| result | |
| } | |
| mae = function(pred,test) | |
| { | |
| errSum<-mean(abs(pred-test)) #注意 和wape的实现相比是不是简化了很多 | |
| errSum | |
| } | |
| rmse = function(pred,test) | |
| { | |
| res<- sqrt(mean((pred-test)^2) ) | |
| res | |
| } | |
| # | |
| library(tseries) | |
| library(zoo) | |
| library(forecast) | |
| air <- AirPassengers | |
| ts.plot(air) | |
| passenger<-air | |
| p<-unlist(passenger) | |
| pt<-ts(p,frequency=12,start=2001) | |
| plot(pt) | |
| train<-window(pt,start=2001,end=2011+11/12) | |
| test<-window(pt,start=2012) | |
| library(forecast) | |
| pred_meanf<-meanf(train,h=12) | |
| rmse(test,pred_meanf$mean) #226.2657 | |
| pred_naive<-naive(train,h=12) | |
| rmse(pred_naive$mean,test)#102.9765 | |
| pred_snaive<-snaive(train,h=12) | |
| rmse(pred_snaive$mean,test)#50.70832 | |
| pred_rwf<-rwf(train,h=12, drift=T) | |
| rmse(pred_rwf$mean,test)#92.66636 | |
| pred_ses <- ses(train,h=12,initial='simple',alpha=0.2) | |
| rmse(pred_ses$mean,test) #89.77035 | |
| pred_holt<-holt(train,h=12,damped=F,initial="simple",beta=0.65) | |
| rmse(pred_holt$mean,test)#76.86677 without beta=0.65 it would be 84.41239 | |
| pred_hw<-hw(train,h=12,seasonal='multiplicative') | |
| rmse(pred_hw$mean,test)#16.36156 | |
| fit<-ets(train) | |
| accuracy(predict(fit,12),test) #24.390252 结果不对... | |
| pred_stlf<-stlf(train) | |
| rmse(pred_stlf$mean,test)#22.07215 | |
| plot(stl(train,s.window="periodic")) #Seasonal Decomposition of Time Series by Loess | |
| fit2<-auto.arima(train) | |
| accuracy(forecast(fit2,h=12),test) #23.538735 | |
| ma = arima(train, order = c(0, 1, 3), seasonal=list(order=c(0,1,3), period=12)) | |
| p<-predict(ma,12) | |
| accuracy(p$pred,test) #18.55567 | |
| BT = Box.test(ma$residuals, lag=30, type = "Ljung-Box", fitdf=2) |
相关资料链接:


