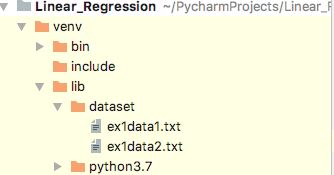
数据放这里:
单特征
import matplotlib.pyplot as plt
import numpy as np
import pandas as pd


# 读取原始数据
def raw_data(path):
    data=pd.read_csv(path,names=['population','profit'])
    return data


# 画原始数据
def draw_data(data):
    x=data['population']
    y=data['profit']
    plt.scatter(x,y,s=15)
    '''
    获取最大值最小值,设置坐标的
    print(max(x),min(x))
    print(max(y),min(y))
    '''
    plt.axis([4, 25, -3, 25])
    plt.title('raw data')
    plt.xlabel('population')
    plt.ylabel('profit')
    return plt


# 代价函数j
def cost_function(theta,x,y):
    j=np.sum(np.power((x.dot(theta)-y),2))/(2*x.shape[0])
    return j


# 梯度下降法
def gradient_descent(theta,x,y):
    # 定义学习率a和迭代次数epoch
    a=0.01
    epoch=1000
    # cost存放每次修改theta后代价函数的值
    cost=[]
    for i in range(epoch):
        theta=theta-(((x.dot(theta)-y).ravel()).dot(x))*a/x.shape[0]
        cost.append(cost_function(theta,x,y))
    return theta,cost


# 画出迭代次数和代价函数的关系
def draw_iteration(cost,epoch=1000):
    plt.plot(range(epoch),cost)
    plt.xlabel('iteration')
    plt.ylabel('cost')
    plt.show()


# 画出回归方程
def draw_final(theta,data):
    plt=draw_data(data)
    x=np.arange(4,25,0.01)
    y=theta[0]+x*theta[1]
    plt.plot(x,y,c='r')
    plt.title('final')
    plt.show()


# 正规方程法
def normal_equation(theta,x,y):
    theta=((np.linalg.inv((x.T).dot(x))).dot(x.T)).dot(y)
    return theta


def main():
    data=raw_data('venv/lib/dataset/ex1data1.txt')
    # print(data.head())    # 检查前几行
    plt=draw_data(data)
    plt.show()
    x=data['population']
    y=data['profit']
    x=np.c_[np.ones(x.size),x]
    theta=np.ones(x.shape[1])
    j=cost_function(theta,x,y)
    theta,cost=gradient_descent(theta,x,y)
    draw_iteration(cost)
    draw_final(theta,data)
    theta=normal_equation(theta,x,y)
    draw_final(theta, data)


main()
    '''
结果如下:
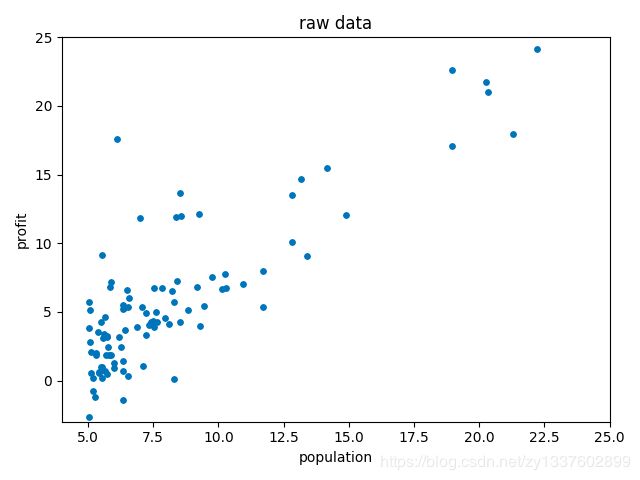
原始数据
迭代次数和代价函数的关系
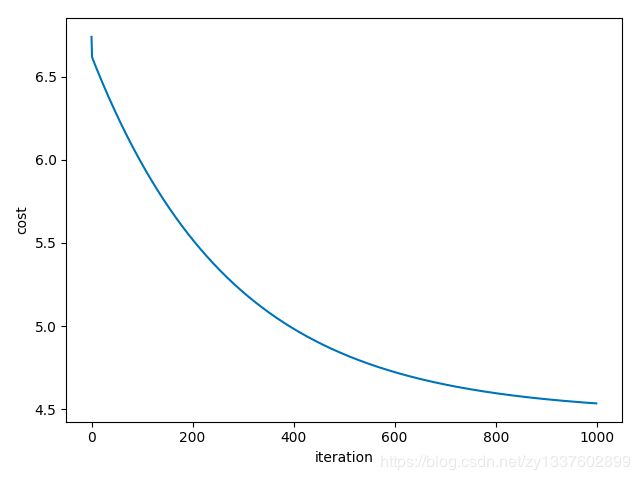
梯度下降法
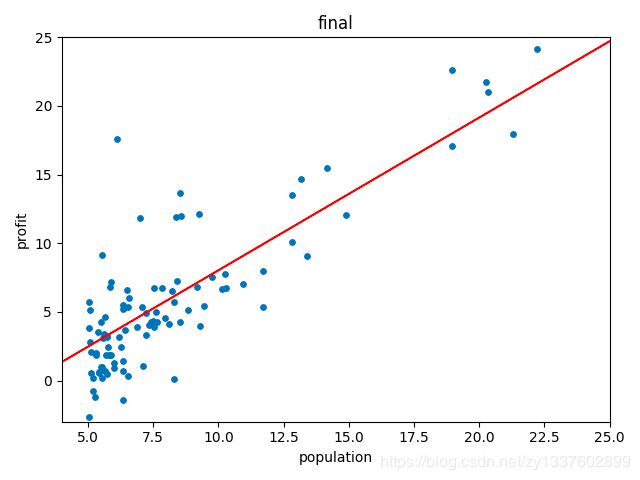
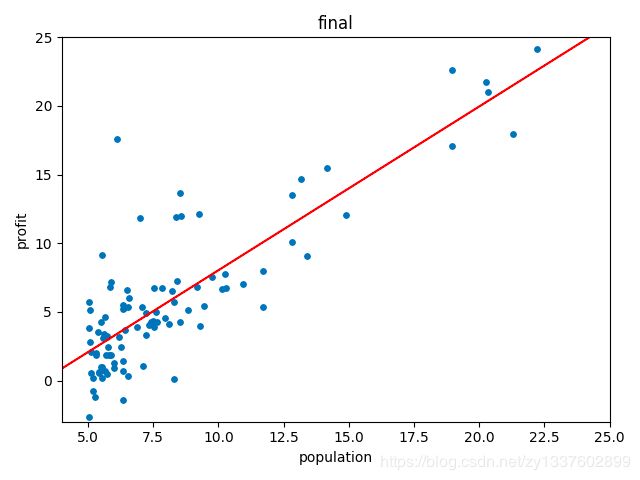
正规方程法
多特征
import matplotlib.pyplot as plt
import numpy as np
import pandas as pd


def raw_data(path):
    data=pd.read_csv(path,names=['size','bedroom','price'])
    return data


# 数据归一化
def normalize_data(data):
    data2=(data-data.mean())/(data.max()-data.min())
    return data2


def cost_function(theta,x,y):
    j=np.sum(np.power(x.dot(theta)-y,2))/(2*x.shape[0])
    return j


def gradient_descent(theta,x,y):
    a=0.01
    epoch=1000
    cost=[]
    for i in range(epoch):
        theta=theta-(((x.dot(theta)-y).ravel()).dot(x))*a/x.shape[0]
        cost.append(cost_function(theta,x,y))
    return theta,cost


def draw_iteration(cost,epoch=1000):
    plt.plot(np.arange(0,epoch),cost)
    plt.title('iteration and cost')
    plt.xlabel('iteration')
    plt.ylabel('cost')
    plt.show()


def normal_equation(theta,x,y):
    theta=((np.linalg.inv((x.T).dot(x))).dot(x.T)).dot(y)
    return theta


def main():
    rawdata=raw_data('venv/lib/dataset/ex1data2.txt')
    normaldata=normalize_data(rawdata)
    # print(normaldata.head())
    x1=normaldata['size']
    x2=normaldata['bedroom']
    y=normaldata['price']
    x=np.c_[np.ones(x1.shape[0]),x1,x2]
    theta=np.ones(x.shape[1])
    j=cost_function(theta,x,y)
    # print(j)
    theta,cost=gradient_descent(theta,x,y)
    draw_iteration(cost)
    # 梯度下降的代价
    print(cost_function(theta,x,y))
    theta=normal_equation(theta,x,y)
    # 正规方程的代价
    print(cost_function(theta,x,y))
	#0.0156070718918562
	#0.007274047883954535

main()
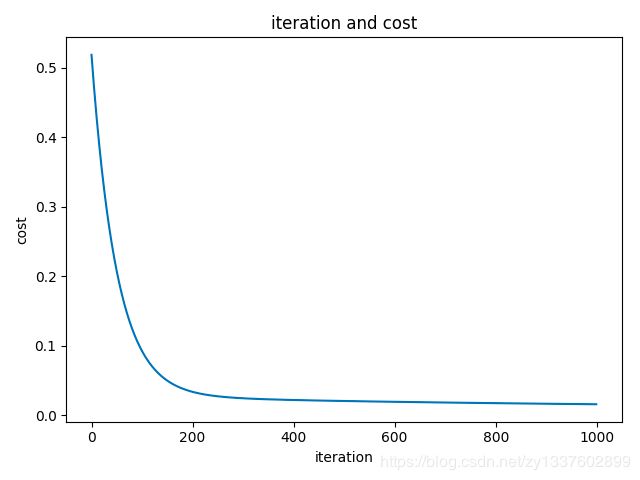
结果如下
