《数据结构与算法》实验:排序算法实验比较——选择排序 & 堆排序
《数据结构与算法》实验和课程Github资源
《数据结构与算法》实验:线性结构及其应用——算术表达式求值
《数据结构与算法》实验:树型结构的建立与遍历
《数据结构与算法》实验:图结构的建立与搜索
《数据结构与算法》实验:查找结构的实验比较——二叉查找树BST & 二分(折半)查找
《数据结构与算法》实验:排序算法实验比较——选择排序 & 堆排序
| 《数据结构与算法》实验报告 |
|||
| 学生姓名 |
郭茁宁 |
院(系) |
计算机科学与技术 |
| 学 号 |
1183710109 |
专 业 |
软件工程 |
| 实验时间 |
2019年12月27日(周五) |
实验地点 |
格物213室 |
| 实验项目 |
实验/5-5:排序算法实验比较(4学时) |
||
| 实验目的:将课程的基本原理、技术和方法与实际应用相结合,训练和提高学生组织、存储和处理信息的能力,以及复杂问题的数据结构设计能力和程序设计能力,培养软件设计与开发所需要的实践能力。 实验要求:灵活运用基本的数据结构和算法知识,对实际问题进行分析和抽象;结合程序设计的一般过程和方法为实际问题设计数据结构和有效算法;用高级语言对数据结构和算法进行编程实现、调试,测试其正确性和有效性。 |
|||
| 实验内容:排序算法的实现与实验比较 实现一组经典的排序算法,通过实验数据的设计,考察不同规模和分布的数据对排序算法运行时间影响的规律,验证理论分析结果的正确性。 1. 实现以下三组排序方法中的一组排序算法: (1)冒泡排序和快速排序; (2)插入排序和希尔排序; (3)选择排序和堆排序。 2. 产生不同规模和分布的数据,以“图或表”的方式给出输入规模和分布对排序方法运行时间变化趋势的影响(画出T(n)的曲线)。并与理论分析结果比较。 3. 将上述“图或表”采用图片等形式贴在实验报告中,与作适当分析或说明。 |
|||
| 数据结构定义: 数组:存放读入元素,用于选择排序 堆:最小堆,用于堆排序 #define N 1000000 int a[N + 5]; |
|||
| 算法设计与分析(要求画出核心内容的程序流程图):
从小到大排序时,排到第i个位置时,应该选择第i+1到第n个位置上最小的元素放在这个位置。在实际编程中,为了不另外开数组空间,在放置位置时,采用“与该位置原本的元素交换”的方法。 void SelectSort(int n) { int mini; for (int i = 1; i < n; i++) { mini = i; for (int j = i + 1; j <= n; j++) if (a[j] < a[mini]) mini = j; if (i != mini) Swap(i, mini); } printf("SelectSort:\n"); }
建堆: 从堆的底层开始建立,保证建立第i层时,第i+1到logN层的元素都满足根节点元素小于其子结点元素,最后整个堆的根节点是整个堆的最小值。 取最小值: 每次取处堆的根结点,然后和任意一个叶子结点交换,并从上到小调整堆。 void HeapAdjust(int x, int n) //调整堆 { if (x * 2 > n) return; int maxi = x * 2 + 1 > n ? x * 2 : (a[x * 2] < a[x * 2 + 1] ? x * 2 : x * 2 + 1); if (a[maxi] < a[x]) Swap(x, maxi), HeapAdjust(maxi, n); } void HeapSort(int n) { for (int i = n; i >= 1; i--) HeapAdjust(i, n); //建立最小堆 for (int i = n; i > 1; i--) { Swap(1, i); //取出堆根节点 HeapAdjust(1, i - 1); //调整堆,此时大小减1 } }
|
|||
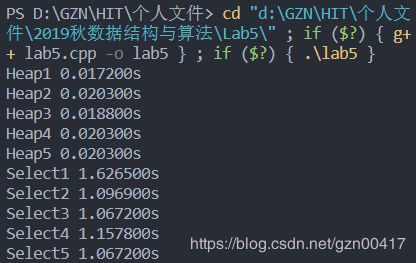
| 实验测试结果及结果分析: Heap1 0.017200s Heap2 0.020300s Heap3 0.018800s Heap4 0.020300s Heap5 0.020300s Select1 1.626500s Select2 1.096900s Select3 1.067200s Select4 1.157800s Select5 1.067200s 示例为100000规模数据,在测试中,每一个规模测试5组数据,舍弃偶然误差,取平均值,进行统计分析。 sta = GetTickCount(); for (int i = 1; i <= M; i++) HeapSort(n); end = GetTickCount();
printf("Heap%d %.6lfs\n", j, (double)(end - sta) / 1000 / M);
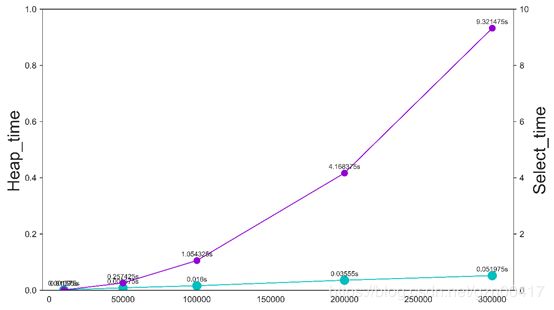
左纵轴、水绿色是堆排序时间,右纵轴、紫色是选择排序时间; 可以从图中看出选择排序的时间曲线是2次函数的曲线,增长速度远超希尔排序的NlogN曲线。 |
|||
| 问题及解决方法:
|
|||
| 源程序名称:lab5.cpp |
|||
注意:正文文字为宋体小4号,图中文字为宋体5号。行距为多倍行距1.25。
源程序与此报告打包提交,压缩包采用学号命名。
// lab5.cpp

#include
#include
#include
#include
#include
using namespace std;
#define Swap(x, y) (a[x] = a[x] ^ a[y], a[y] = a[x] ^ a[y], a[x] = a[x] ^ a[y])
#define N 1000000
int a[N + 5];

void HeapAdjust(int x, int n) //调整堆
{
    if (x * 2 > n) return;
    int maxi = x * 2 + 1 > n ? x * 2 : (a[x * 2] < a[x * 2 + 1] ? x * 2 : x * 2 + 1);
    if (a[maxi] < a[x]) Swap(x, maxi), HeapAdjust(maxi, n);
}

void HeapSort(int n)
{
    for (int i = n; i >= 1; i--) HeapAdjust(i, n); //建立最小堆
    for (int i = n; i > 1; i--)
    {
        Swap(1, i); //取出堆根节点
        HeapAdjust(1, i - 1); //调整堆,此时大小减1
    }
}

void Print(int n)
{
    for (int i = 1; i < n; i++) printf("%d ", a[i]);
    printf("%d\n\n", a[n]);
}

void SelectSort(int n)
{
    int mini;
    for (int i = 1; i < n; i++)
    {
        mini = i;
        for (int j = i + 1; j <= n; j++)
            if (a[j] < a[mini]) mini = j;
        if (i != mini) Swap(i, mini);
    }
}

#define M 10
int main()
{
    freopen("init.txt", "r", stdin);
    //freopen("output.txt", "w", stdout);
    int n;
    DWORD sta, end;
    scanf("%d", &n);
    for (int j = 1; j <= 5; j++)
    {
        for (int i = 1; i <= n; i++) scanf("%d", &a[i]);
        sta = GetTickCount();
        for (int i = 1; i <= M; i++) HeapSort(n);
        end = GetTickCount();
        printf("Heap%d %.6lfs\n", j, (double)(end - sta) / 1000 / M);
    }
    for (int j = 1; j <= 5; j++)
    {
        for (int i = 1; i <= n; i++) scanf("%d", &a[i]);
        sta = GetTickCount();
        SelectSort(n);
        end = GetTickCount();
        printf("Select%d %.6lfs\n", j, (double)(end - sta) / 1000 / M);
    }
    fclose(stdin);
    fclose(stdout);
    return 0;
}
// create_data.cpp
#include
#include
#define N 100000
#define M (1 << 30)
int main()
{
freopen("init.txt", "w", stdout);
printf("%d\n", N);
for (int j = 1; j <= 5; j++, printf("\n"))
for (int i = 1; i <= N; i++)
{
int x = rand() % M + 1, y = rand() % 15;
x = x << y;
printf("%d ", x);
}
fclose(stdout);
return 0;
}
# d.py 画图

import matplotlib.pyplot as plt
import numpy as np
import seaborn as sns

heap_n = [10000, 50000, 100000, 200000, 300000]
heap_t = [0.001575, 0.008575, 0.016, 0.03555, 0.051975]
slct_n = [10000, 50000, 100000, 200000, 300000]
slct_t = [0.01095, 0.257425, 1.054325, 4.168375, 9.321475]

plt.rcParams["figure.figsize"] = (10.0, 6.0)
fig = plt.figure()
style = ["darkgrid", "dark", "white", "whitegrid", "ticks"]
sns.set_style(style[2])

ax1 = fig.add_subplot(111)
ax1.set_ylim([0, 1])
ax1.plot(heap_n, heap_t, "c", ms=10, lw=1, marker="o")  # 设置线粗细,节点样式
ax1.set_ylabel("Heap_time", fontsize="20")
ax1.tick_params(labelsize=10)
for x, y in zip(heap_n, heap_t):  # # 添加数据标签
    plt.text(
        x, y + 0.01, str(y) + "s", ha="center", va="bottom", fontsize=8, rotation=0
    )
# plt.plot(heap_t, label="heap")
# plt.legend(bbox_to_anchor=(0.15, 1.0))

ax2 = ax1.twinx()
ax2.set_ylim([0, 10])
ax2.plot(slct_n, slct_t, "darkviolet", ms=7, lw=1, marker="o")  # 设置线粗细,节点样式
ax2.set_ylabel("Select_time", fontsize="20")
ax2.tick_params(labelsize=10)
for x, y in zip(slct_n, slct_t):  # # 添加数据标签
    plt.text(x, y + 0.1, str(y) + "s", ha="center", va="bottom", fontsize=8, rotation=0)
# plt.plot(slct_t, label="slct")
"""
plt.legend(
    bbox_to_anchor=(0.0, 1.02, 1.0, 0.102),
    loc=0,
    ncol=3,
    mode="expand",
    borderaxespad=0.0,
)
"""
plt.savefig(r"D:\GZN\HIT\个人文件\2019秋数据结构与算法\Lab5\1.png", dpi=1000, bbox_inches="tight")
plt.grid()
plt.show()


