机器学习实战:房价预测
项目介绍
- 背景:DC竞赛比赛项目,运用回归模型进行房价预测。
- 数据介绍:
数据主要包括2014年5月至2015年5月美国King County的房屋销售价格以及房屋的基本信息。
其中训练数据主要包括10000条记录,14个字段,分别代表:
销售日期(date):2014年5月到2015年5月房屋出售时的日期;
销售价格(price):房屋交易价格,单位为美元,是目标预测值;
卧室数(bedroom_num):房屋中的卧室数目;
浴室数(bathroom_num):房屋中的浴室数目;
房屋面积(house_area):房屋里的生活面积;
停车面积(park_space):停车坪的面积;
楼层数(floor_num):房屋的楼层数;
房屋评分(house_score):King County房屋评分系统对房屋的总体评分;
建筑面积(covered_area):除了地下室之外的房屋建筑面积;
地下室面积(basement_area):地下室的面积;
建筑年份(yearbuilt):房屋建成的年份;
修复年份(yearremodadd):房屋上次修复的年份;
纬度(lat):房屋所在纬度;
经度(long):房屋所在经度。 - 目标:算法通过计算平均预测误差来衡量回归模型的优劣。平均预测误差越小,说明回归模型越好。
代码详解
数据导入
先导入分析需要的python包:
#导入类库和加载数据集
import pandas as pd
import numpy as np
import matplotlib.pyplot as plt
import seaborn as sns
%matplotlib inline
导入下载好的kc_train的csv文件:
#读取数据
train_names = ["date",
               "price",
               "bedroom_num",
               "bathroom_num",
               "house_area",
               "park_space",
               "floor_num",
               "house_score",
               "covered_area",
               "basement_area",
               "yearbuilt",
               "yearremodadd",
               "lat",
               "long"]
data = pd.read_csv("kc_train.csv",names=train_names)
data.head()
数据预处理
查看数据集概况
# 观察数据集概况
data.info()
拆分数据:把原始数据中的年月日拆开,然后根据房屋的建造年份和修复年份计算一下售出时已经过了多少年,这样就有17个特征。
sell_year,sell_month,sell_day=[],[],[]
house_old,fix_old=[],[]
for [date,yearbuilt,yearremodadd] in data[['date','yearbuilt','yearremodadd']].values:
    year,month,day=date//10000,date%10000//100,date%100
    sell_year.append(year)
    sell_month.append(month)
    sell_day.append(day)
    house_old.append(year-yearbuilt)
    if yearremodadd==0:
        fix_old.append(0)
    else:
        fix_old.append(year-yearremodadd)
del data['date']
data['sell_year']=pd.DataFrame({'sell_year':sell_year})
data['sell_month']=pd.DataFrame({'sell_month':sell_month})
data['sell_day']=pd.DataFrame({'sell_day':sell_day})
data['house_old']=pd.DataFrame({'house_old':house_old})
data['fix_old']=pd.DataFrame({'fix_old':fix_old})
data.head()
观察因变量(price)数据情况
#观察数据
print(data['price'].describe())
#观察price的数据分布
plt.figure(figsize = (10,5))
# plt.xlabel('price')
sns.distplot(data['price'])

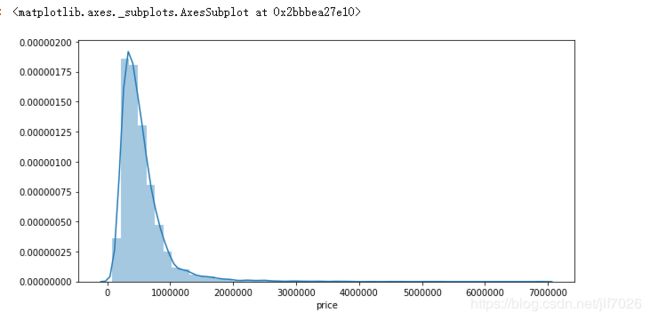
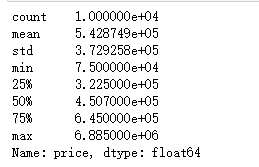
从数据和图片上可以看出,price呈现典型的右偏分布,但总体上看还是符合一般规律。
相关性分析
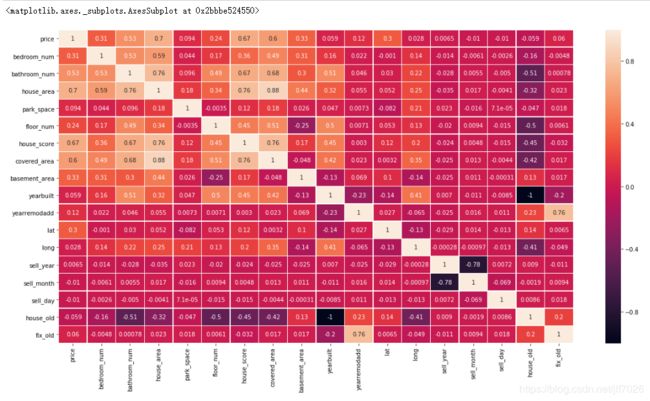
自变量与因变量的相关性分析,绘制相关性矩阵热力图,比较各个变量之间的相关性:
#自变量与因变量的相关性分析
plt.figure(figsize = (20,10))
internal_chars = ['price','bedroom_num','bathroom_num','house_area','park_space','floor_num','house_score','covered_area'
                  ,'basement_area','yearbuilt','yearremodadd','lat','long','sell_year','sell_month','sell_day',
                 'house_old','fix_old']
corrmat = data[internal_chars].corr()  # 计算相关系数
sns.heatmap(corrmat, square=False, linewidths=.5, annot=True) #热力图
#打印出相关性的排名
print(corrmat["price"].sort_values(ascending=False))

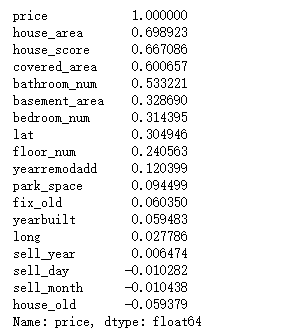
可以看出house_area,house_score,covered_area,bathroom_num这四个特征对price的影响最大,都超过了0.5。负数表明与price是负相关的。
特征选择
一般来说,选择一些与因变量(price)相关性比较大的做特征,但我尝试过选择前十的特征,然后进行建模预测,但得到的结果并不是很好,所以我还是把现有的特征全部用上。
归一化
对于各个特征的数据范围不一样,影响线性回归的效果,因此归一化数据。
#特征缩放
data = data.astype('float')
x = data.drop('price',axis=1)
y = data['price']
from sklearn.preprocessing import MinMaxScaler
scaler = MinMaxScaler()
newX= scaler.fit_transform(x)
newX = pd.DataFrame(newX, columns=x.columns)
newX.head()
划分数据集
#先将数据集分成训练集和测试集
from sklearn.model_selection import train_test_split
X_train,X_test,y_train,y_test = train_test_split(newX, y, test_size=0.2, random_state=21)
建立模型
选择两个模型进行预测,观察那个模型更好。
- 线性回归
- 随机森林
#模型建立
from sklearn import metrics
def RF(X_train, X_test, y_train, y_test):    #随机森林
    from sklearn.ensemble import RandomForestRegressor
    model= RandomForestRegressor(n_estimators=200,max_features=None)
    model.fit(X_train, y_train)
    predicted= model.predict(X_test)
    mse = metrics.mean_squared_error(y_test,predicted)
    return (mse/10000)

def LR(X_train, X_test, y_train, y_test):    #线性回归
    from sklearn.linear_model import LinearRegression
    LR = LinearRegression()
    LR.fit(X_train, y_train)
    predicted = LR.predict(X_test)
    mse = metrics.mean_squared_error(y_test,predicted)
    return (mse/10000)
评价标准
算法通过计算平均预测误差来衡量回归模型的优劣。平均预测误差越小,说明回归模型越好。
print('RF mse: ',RF(X_train, X_test, y_train, y_test))
print('LR mse: ',LR(X_train, X_test, y_train, y_test))
总结
对机器学习有了初步了解。但对于数据的预处理,和参数,特征,模型的调优还很欠缺。
希望通过以后的学习,能不断提高。


