Python 数据分析微专业课程--项目实战13 婚恋配对实验
1.项目说明
创建模型模拟1万男性和1万女性的婚恋配对实验,男性和女性都有财富、内涵、外貌三个属性的得分,并根据不同的择偶策略选择对象。
2.项目具体要求
1、样本数据处理
   ①样本要求:
   按照一定规则生成了1万男性+1万女性样本:
   在配对实验中,这2万个样本具有各自不同的个人属性(财富、内涵、外貌),每项属性都有一个得分
   财富值符合指数分布,内涵和颜值符合正态分布
   三项的平均值都为60分,标准差都为15分
   ②构建函数实现样本数据生成模型,函数参数之一为“样本数量”,并用该模型生成1万男性+1万女性数据样本

2、生成99个男性、99个女性样本数据,分别针对三种策略构建算法函数
   策略:
   择偶策略1:门当户对,要求双方三项指标加和的总分接近,差值不超过20分;
   择偶策略2:男才女貌,男性要求女性的外貌分比自己高出至少10分,女性要求男性的财富分比自己高出至少10分;
   择偶策略3:志趣相投、适度引领,要求对方的内涵得分在比自己低10分~高10分的区间内,且外貌和财富两项与自己的得分差值都在5分以内
   要求:
   ① 生成样本数据
   ② 给男性样本数据,随机分配策略选择 → 这里以男性为出发作为策略选择方
   ③ 尝试做第一轮匹配,记录成功的匹配对象,并筛选出失败的男女性进入下一轮匹配
   ④ 构建模型,并模拟1万男性+1万女性的配对实验

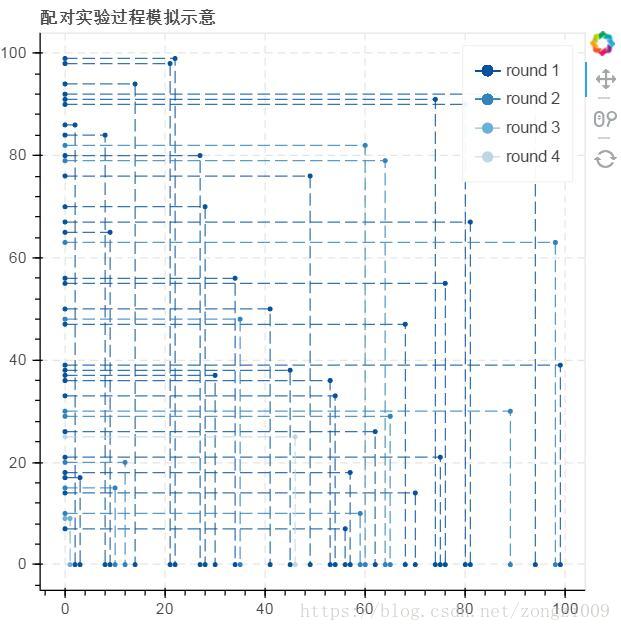
3、以99男+99女的样本数据,绘制匹配折线图
   要求:
   ① 生成样本数据,模拟匹配实验
   ② 生成绘制数据表格

4、生成“不同类型男女配对成功率”矩阵图
   要求:
   ① 以之前1万男+1万女实验的结果为数据
   ② 按照财富值、内涵值、外貌值分别给三个区间,以区间来评判“男女类型”
   ③ 绘图查看不同类型的配对成对率
3.实现思路:
1.生成男女样本数据,根据样本要求可以使用随机数方法生成财富、内涵、外貌三个属性数据,用索引来标记男女,
可以创建函数来生成样本数据,输入性别和数量参数即可。
2.创建完成的算法函数,最关键的是对最基本的情景的模拟,这里最重要的模拟第一轮的配对。第一轮的配对要模拟一下几个步骤:
  a.生成男女样本
  b.对男性样本随机分配策略,然后进行第一轮的随机配对。
  c.根据策略要求,将配对成功的男性样本和女性样本从总样本中移除,可以创建一个表格用于存放成功配对样本
  d.剩余样本进入下一轮配对。
  然后根据基本模型进行扩展,创建完整的算法函数,通过输入样本量参数,来模拟不同样本量的配对,并返回样本数据和配对成功样本数据。
用于之后的统计分析。可以用男性和女性样本ID作为x轴和y轴,绘制折线图来模拟每一轮的男女配对情况。
3.分析不通过男女类型的配对成功率,首先需要对原始样本做类别划分,然后将成功配对的数据连接类别,然后根据男女类别分组计数,就可以
计算得到不同男女类别的成功率,已男女类别分别为X,Y 轴绘制散点图,用成功率设置透明度,则可以看到那些不同类别的成功率分布情况。
4.实现过程:
import numpy as np
import pandas as pd
import matplotlib.pyplot as plt
%matplotlib inline

from bokeh.io import output_notebook
output_notebook()

from bokeh.plotting import figure,show
from bokeh.models import ColumnDataSource

import warnings
warnings.filterwarnings('ignore')

#构建生成样本数据函数
def samples(gender,n):
    sample = pd.DataFrame({'fortune':np.random.exponential(15,size = n)+45,#生成呈指数分布随机数--财富
                     'charactor':np.random.normal(60,15,size = n),  #生成正太分布随机数--内涵
                     'appearance':np.random.normal(60,15,size = n)}, #生成正太分布随机数--外貌
                     index = [gender+str(i) for i in range(1,n+1)])
    sample.index.name = 'Id'
    sample['score'] = sample.sum(axis = 1)/3 #指标平均数作为综合指标
    return sample

#生成10000男性 +10000女性样本
male_samples = samples('m',10000)
female_samples = samples('f',10000)

#对男性样本数据绘制堆叠柱状图
male_samples.iloc[:50,:3].plot(kind = 'bar',figsize = (14,5),stacked = True,legend =True,colormap = 'Blues_r',edgecolor = 'black')
plt.grid(linestyle = '--')
#对女性样本数据绘制堆叠柱状图
female_samples.iloc[:50,:3].plot(kind = 'bar',figsize = (14,5),stacked = True,legend =True,colormap = 'Reds_r',edgecolor = 'black')
plt.grid(linestyle = '--')

print(male_samples.head(20))
说明:
1.这里创建函数来生成样本数据,输入性别和数量参数,即可生成指定性别和样本量的的数据。
2.使用两个随机数生成方法来生成数据,指数分布随机数np.random.exponential(),正态分布随机数np.random.normal(),输入均值,标准差,样本量参数,就可以生成满足要求的随机数样本。财富属性需符合指数分布,内涵和外貌需符合正态分布。dataframe的索引作为样本身份id.
3.创建样本之后根据三个属性绘制堆叠柱状图来了解男女样本的属性得分情况。
#生成99个男性和99个女性样本数据
male_sample_test = samples('m',99)
female_sample_test = samples('f',99)

#为男性样本随机分配择偶策略
male_sample_test['strategy'] = np.random.choice([1,2,3],99)

#创建一个表格用于存放配对成功的样本
match_succeed = pd.DataFrame(data = None,index = None,columns = ['f','m','round_n','strategy_type'])

#模拟第一轮配对
round1_m = male_sample_test.copy()  #第一轮可配对男性
round1_f = female_sample_test.copy() #第一轮可配对女性
round1_m['choice'] = np.random.choice(round1_f.index,len(round1_m))  #进行男女随机配对
round1_match = pd.merge(round1_m,round1_f,left_on = 'choice',right_index = True) #连接配对成功的男女数据
round1_match['appearance_dif'] =np.abs(round1_match['appearance_x']-round1_match['appearance_y']) #外貌值差
round1_match['charactor_dif'] =np.abs(round1_match['charactor_x']-round1_match['charactor_y']) #内涵值差
round1_match['fortune_dif'] =np.abs(round1_match['fortune_x']-round1_match['fortune_y']) #财富值差
round1_match['score_dif'] =np.abs(round1_match['score_x']-round1_match['score_y']) #综合值差

#择偶策略1配对
#筛选出策略1配对成功的数据
strategy1_match = round1_match[(round1_match['strategy']==1)&(round1_match['score_dif']<=(20/3))]
#处理策略配对成功的数据,并添加到配对成功的表格
strategy1_match = strategy1_match.sort_values(['choice','score_x'],ascending = False)
strategy1_succeed = strategy1_match[~strategy1_match['choice'].duplicated()] #若多为男性选择一位女性,则选择综合分数最高的男性
strategy1_succeed= strategy1_succeed[['choice','strategy']].reset_index()
strategy1_succeed.columns =['m','f','strategy_type']
strategy1_succeed['round_n'] = 1
match_succeed = pd.concat([match_succeed,strategy1_succeed]) #添加数据值配对成功表格

#择偶策略2进行配对
#筛选出策略2配对成功的数据
strategy2_match = round1_match[(round1_match['appearance_x']-round1_match['appearance_y']<=-10)&
                (round1_match['fortune_x']-round1_match['fortune_y']>=10)&
                (round1_match['strategy']==2)]
#处理策略配对成功的数据,并添加到配对成功的表格
strategy2_match = strategy2_match.sort_values(['choice','score_x'],ascending = False)
strategy2_succeed = strategy2_match[~strategy2_match['choice'].duplicated()]#若多为男性选择一位女性,则选择综合分数最高的男性
strategy2_succeed= strategy2_succeed[['choice','strategy']].reset_index()
strategy2_succeed.columns =['m','f','strategy_type']
strategy2_succeed['round_n'] = 1
match_succeed = pd.concat([match_succeed,strategy2_succeed])#添加数据值配对成功表格

#择偶策略3进行配对
#筛选出策略3配对成功的数据
strategy3_match = round1_match[(round1_match['appearance_dif']<5)&
                (round1_match['fortune_dif']<5)&
                (round1_match['charactor_dif']>10)&
                (round1_match['strategy']==3)]

strategy3_match = strategy3_match.sort_values(['choice','score_x'],ascending = False)
strategy3_succeed = strategy3_match[~strategy3_match['choice'].duplicated()]#若多为男性选择一位女性,则选择综合分数最高的男性
strategy3_succeed= strategy3_succeed[['choice','strategy']].reset_index()
strategy3_succeed.columns =['m','f','strategy_type']
strategy3_succeed['round_n'] = 1
match_succeed = pd.concat([match_succeed,strategy3_succeed])#添加数据值配对成功表格

#样本数据中删除已经配对的样本
male_sample_test.drop(match_succeed['m'].tolist(),inplace = True)
female_sample_test.drop(match_succeed['f'].tolist(),inplace = True)

#创建配对算法模型
def match_model(i):
    #创建样本
    male_samples = samples('m',i)
    female_samples = samples('f',i)

    #对男性样本随机分配择偶策略
    male_samples['strategy'] = np.random.choice([1,2,3],i)
    #创建表格用于存储已配对成功的数据
    match_succeed = pd.DataFrame(data = None,index = None,columns = ['f','m','round_n','strategy_type'])

    #复制原样本数据用于配对
    male_sample_copy = male_samples.copy()
    female_sample_copy = female_samples.copy()
    n = 1  #表示第几轮

    #循环配对,当没有任何配对成功时,停止实验
    while True:
        round_m = male_sample_copy.copy()  #第n轮可配对男性
        round_f = female_sample_copy.copy() #第n轮可配对女性
        #创建表格用于存储本轮配对成功的样本数据
        round_succeed = pd.DataFrame(data = None,index = None,columns = ['f','m','round_n','strategy_type'])
        round_m['choice'] = np.random.choice(round_f.index,len(round_m))  # #进行男女随机配对
        round_match = pd.merge(round_m,round_f,left_on = 'choice',right_index = True)
        round_match['appearance_dif'] =np.abs(round_match['appearance_x']-round_match['appearance_y'])
        round_match['charactor_dif'] =np.abs(round_match['charactor_x']-round_match['charactor_y'])
        round_match['fortune_dif'] =np.abs(round_match['fortune_x']-round_match['fortune_y'])
        round_match['score_dif'] =np.abs(round_match['score_x']-round_match['score_y'])


        #择偶策略1进行配对
        strategy1_match = round_match[(round_match['strategy']==1)&(round_match['score_dif']<=(20/3))]
        strategy1_match = strategy1_match.sort_values(['choice','score_x'],ascending = False)
        strategy1_succeed = strategy1_match[~strategy1_match['choice'].duplicated()]
        strategy1_succeed= strategy1_succeed[['choice','strategy']].reset_index()
        strategy1_succeed.columns =['m','f','strategy_type']
        strategy1_succeed['round_n'] = n
        #strategy1_succeed 为策略1配对成功的样本数据

        #择偶策略2进行配对
        strategy2_match = round_match[(round_match['appearance_x']-round_match['appearance_y']<=-10)&
                                        (round_match['fortune_x']-round_match['fortune_y']>=10)&
                                        (round_match['strategy']==2)]

        strategy2_match = strategy2_match.sort_values(['choice','score_x'],ascending = False)
        strategy2_succeed = strategy2_match[~strategy2_match['choice'].duplicated()]
        strategy2_succeed= strategy2_succeed[['choice','strategy']].reset_index()
        strategy2_succeed.columns =['m','f','strategy_type']
        strategy2_succeed['round_n'] = n
        #strategy2_succeed 为策略2配对成功的样本数据


        #择偶策略3进行配对
        strategy3_match = round_match[(round_match['appearance_dif']<5)&
                        (round_match['fortune_dif']<5)&
                        (round_match['charactor_dif']<10)&
                        (round_match['strategy']==3)]

        strategy3_match = strategy3_match.sort_values(['choice','score_x'],ascending = False)
        strategy3_succeed = strategy3_match[~strategy3_match['choice'].duplicated()]
        strategy3_succeed= strategy3_succeed[['choice','strategy']].reset_index()
        strategy3_succeed.columns =['m','f','strategy_type']
        strategy3_succeed['round_n'] = n
        #strategy3_succeed 为策略3配对成功的样本数据

        #将策略1,策略2,策略3配对成功的样本数据连接,即为本轮成功配对的样本数据
        round_succeed = pd.concat([strategy1_succeed,strategy2_succeed,strategy3_succeed])

        #若本轮没有任何配对成功的数据,则退出循环
        if len(round_succeed)==0:
            break

        #将本轮配对成功的样本数据添加到已配对成功表格
        match_succeed = pd.concat([match_succeed,round_succeed],ignore_index = True)

        #删除本轮配对成功的样本
        male_sample_copy.drop(round_succeed['m'].tolist(),inplace =True)
        female_sample_copy.drop(round_succeed['f'].tolist(),inplace =True)

        #配对情况打印
        print('成功进行第%i轮实验,本轮实验成功匹配%i对,总共成功匹配%i对,还剩下%i位男性和%i位女性' %
            (n,len(round_succeed),len(match_succeed),len(male_sample_copy),len(female_sample_copy)))
        n +=1

    return (match_succeed,male_samples,female_samples)  #返回配对成功表格,原始男性样本数据和女性样本数据

match_data1 = match_model(10000) #使用配对模型进行配对模拟

#模拟10000男性+10000女性配对试验

match_succeed1 = match_data1[0] #成功配对的数据
male_sample1 = match_data1[1] #原始男性样本数据
female_sample1 = match_data1[2] #原始女性样本数据

strategy_count = male_sample1.groupby('strategy')[['strategy']].size() #根据策略分组,计算不同策略的原始数量
strategy_match_count = match_succeed1.groupby('strategy_type').size() #根据策略分组,计算不同策略配对成功数量
match_pd1 = pd.DataFrame({'strategy_count':strategy_count,'strategy_match_count':strategy_match_count,
                 'strategy_match_per':strategy_match_count/strategy_count},index = [1,2,3]) #构建DATAFRAME

print('%.2f%%的样本数据成功匹配到了对象' % (len(match_succeed)/10000*100))  #总体配对成功率
print('------------')
print('择偶策略1的匹配成功率为 %.2f%%' % (match_pd1.loc[1,'strategy_match_per']*100)) #策略1配对成功率
print('择偶策略2的匹配成功率为 %.2f%%' % (match_pd1.loc[2,'strategy_match_per']*100)) #策略2配对成功率
print('择偶策略3的匹配成功率为 %.2f%%' % (match_pd1.loc[3,'strategy_match_per']*100)) #策略3配对成功率
print('\n-------------')

match_df2 = pd.merge(match_succeed1,male_sample1,left_on = 'm',right_index = True) #成功配对数据连接男性指标数据
match_mean = match_df2.groupby('strategy').mean() #根据策略分组计算不同指标均值
match_mean.drop('score',axis = 1,inplace = True)
match_mean.columns = ['外貌均值','内涵均值','财富均值']  #重命名字段
match_mean.index = ['择偶策略1','择偶策略2','择偶策略3'] #重命名索引

    #输出不同策略下,配对成功的男性各指标平均值
print('择偶策略1的男性-> ,外貌均值为%.2f%%,内涵均值为%.2f%%,财富均值为 %.2f%%' %
    (match_mean.iloc[0,0],match_mean.iloc[0,1],match_mean.iloc[0,2]))
print('择偶策略2的男性-> ,外貌均值为%.2f%%,内涵均值为%.2f%%,财富均值为 %.2f%%' %
    (match_mean.iloc[1,0],match_mean.iloc[1,1],match_mean.iloc[1,2]))
print('择偶策略3的男性-> ,外貌均值为%.2f%%,内涵均值为%.2f%%,财富均值为 %.2f%%' %
    (match_mean.iloc[2,0],match_mean.iloc[2,1],match_mean.iloc[2,2]))

#绘制不同策略下,不同指标的分布箱型图
match_df2.boxplot(column = ['appearance','charactor','fortune'],by ='strategy',figsize = (13,7),layout = (1,3),sym = '+')
plt.savefig('不同策略指标箱型图.png')
说明:
1.创建算法模型首先需要构建一个基本模型来模拟最为基本的情景,这里先创建一个小样本,男女各99名,然后用代码来模拟第一轮的配对。
2.对男性样本使用np.random.choice([1,2,3],99)来随机分配策略,然后将女性样本做随机选择,然后将选出的数据与男性样本连接,即进行了第一轮的配对。
3.这里最难得地方是需要根据不同策略判断配对是否成功,将成功的样本数据筛选出来,剩下的样本用于下一轮配对。3个策略都是对三个属性差值绝对值的判断,因此可以先求出三个属性差值的绝对值,然后分三步来筛选出符合每个策略的样本数据,最后将匹配成功的样本数据添加至一个专门的表格,然后再从原样本数据中
删除以及配对成功的样本数据,这样就完成了第一轮的配对,剩下的数据就可以用于第二轮配对,直到三个策略的配对都为0的时候就算是结束。
4.完成第一轮配对的代码后,就可以创建算法函数来模拟不同样本下的完整的配对操作。函数最后返回初始样本数据和配对成功样本数据。以用于进一步分析。
5.进一步对数据进行分析,主要分析不同择偶策略的成功率和男性各个属性值的分布。通过计算可到以下几点数据:
a.择偶策略1–门当户对,要求双方三项指标加和的总分接近,差值不超过20分。该策略的成功率最高接近100%。
b.择偶策略2:男才女貌,男性要求女性的外貌分比自己高出至少10分,女性要求男性的财富分比自己高出至少10分;该策略的成功率最低,只有38%。
c.择偶策略3:志趣相投、适度引领,要求对方的内涵得分在比自己低10分~高10分的区间内,且外貌和财富两项与自己的得分差值都在5分以内,
该策略成功率中等达到77%。
6.所以先现实中的相同,门当户对才更容易找到合适结婚的人,过分女方过于要求男方的财富或者男方过于要求女方的外貌都比较难找到合适的人。
from bokeh.palettes import brewer

#以99男性+99女性样本数据进行配对模拟
match_data2 = match_model(99)
match_succeed2 = match_data2[0] #成功配对数据
male_sample2 = match_data2[1] #原始男性样本数据
female_sample2 = match_data2[2] #原始女性样本数据

#成功配对数据连接男性,女性指标数据
linePlot_data = pd.merge(match_succeed2,female_sample2[['score']],left_on = 'f',right_index = True)
linePlot_data = pd.merge(linePlot_data,male_sample2[['score']],left_on = 'm',right_index = True)

#将男性,女性数字编号提取出来
linePlot_data['x'] = linePlot_data['f'].str.strip('f')
linePlot_data['y'] = linePlot_data['m'].str.strip('m')

#生成x轴,y轴绘图列表
linePlot_data['x'] = linePlot_data['x'].apply(lambda x: [0,x,x])
linePlot_data['y']= linePlot_data['y'].apply(lambda y: [y,y,0])

#根据轮数生成颜色列表
rounds = linePlot_data['round_n'].unique().size
colors = brewer['BuPu'][rounds]
linePlot_data['color'] = None

#根据轮数添加颜色字段
for i in linePlot_data['round_n'].unique().tolist():
    linePlot_data.loc[linePlot_data['round_n']==i,'color'] = colors[i-1]


# bokeh绘图
p = figure(plot_width=800, plot_height=800,title="配对实验过程模拟示意" ,tools= 'reset,wheel_zoom,pan')   # 构建绘图空间

#循环绘制点图,折线图
for data in linePlot_data.values:
    p.circle(data[-3],data[-2],color = data[-1],size = 10,legend = 'round%i'%data[2])
    p.line(data[-3],data[-2],color = data[-1],line_dash = [10,6],legend = 'round%i'%data[2])

p.legend.location = 'top_right'
p.legend.click_policy = 'hide' #设置图例隐藏
p.xaxis.axis_label = 'female'
p.yaxis.axis_label = 'male'
show(p)
说明:
1.一次配对实验需要经过多轮配对,这里用99个男女样本进行配对实验进行了9轮配对,那这9轮配对的过程是怎么的,每一轮都有哪些配对成功,这里使用点和线对每一轮配对成功的男女进行连接,点线颜色递减,来表示是哪一轮的配对连接。这里使用bokeh来绘制。
2.x轴女性id,y轴男性id,所以首先需要从已成功配对样本数据中分别筛选出男性数据和女性数据,然后根据id创建字段用于绘图格式为[0,x,x],[y,y,0]。
3.根据轮数生成颜色列表,使用for循环获得每一对的数据绘制点线,并设置颜色。这里可以将图例设置可隐藏,这样就可以查看每一轮的配对情况。
#创建函数对样本各指标进行分类
def type_set(data):
    #循环对外貌,内涵,财富指标根据区间划分为高,中,低三类
    for i in ['appearance','charactor','fortune']:
        data.loc[data[i]>70,'%s_type'%i] = '高'
        data.loc[data[i]<50,'%s_type'%i] = '低'
        data.loc[(data[i]>=50) &(data[i]<=70),'%s_type'%i] = '中'
    #对类型添加指标
    data['appearance_type'] = data['appearance_type'].apply(lambda x:'颜'+x)
    data['charactor_type'] = data['charactor_type'].apply(lambda x:'品'+x)
    data['fortune_type'] = data['fortune_type'].apply(lambda x:'财'+x)
    #财品貌分类字段
    data['type'] =data['fortune_type']+ data['charactor_type']+data['appearance_type']
return data

from bokeh.models import HoverTool

f_type = type_set(female_sample1) #对原始女性样本进行类别划分
m_type = type_set(male_sample1) #对原始男性样本进行类别划分
#成功匹配数据连接分类数据
match_type_data = pd.merge(match_succeed1,f_type[['type']],left_on = 'f',right_index = True)
match_type_data = pd.merge(match_type_data,m_type[['type']],left_on = 'm',right_index = True,suffixes=('_f','_m'))
type_count_data = match_type_data.groupby(['type_f','type_m'])['f','m'].count().reset_index()

#匹配成功
type_count_data['chance'] = type_count_data['m']/type_count_data['m'].sum()
#匹配成功率标准化作为透明度字段
type_count_data['alpha'] = (type_count_data['chance'] - type_count_data['chance'].min())/(type_count_data['chance'].max()- type_count_data['chance'].min())*8

#将男女财品貌类别作为 x轴,y轴
mlist = type_count_data['type_m'].value_counts().index.tolist()
flist = type_count_data['type_f'].value_counts().index.tolist()

#数据生成
source =ColumnDataSource(data = type_count_data)

#标签设置
hover = HoverTool(tooltips =[('男性类别','@type_m'),
                ('女性类别','@type_f'),
                ('匹配成功率','@chance')])

#生成绘制对象
p = figure(x_range = mlist,y_range = flist,plot_width = 700,plot_height = 700,title = '不同类型男女配对成功率',
        tools = [hover,'lasso_select,wheel_zoom,reset,crosshair'],x_axis_label = '男',y_axis_label = '女')

#绘制方形图
p.square(x = 'type_m',y = 'type_f',size= 15,source = source,color = 'red',alpha = 'alpha')
p.xaxis.major_label_orientation = "vertical" #x轴刻度标签设置为纵向
show(p)
说明:
1.分析不同类型的男女配对成功率,首先需要根据样本的三个属性进行划分,这里创建一个函数来完成类型划分。
2.划分完毕的数据和已成功配对的样本数据进行连接,根据每一对的类型进行分组计数,然后就可以计算每一配对类型的成功率,
3.以男性和女性的所有分类分别作为x轴y轴,用bokeh绘制散点图,用成功率设置散点图透明率,根据散点颜色深浅就可知哪些类型配对成功率高。
5.总结
- 这个项目相比财富分配模拟更加复杂,包括整个模拟过程和对模拟完毕之后数据的进一步分析,对模型实现过程需要有完整而清晰的理解。
- 该项目的匹配模型可以作为一般性匹配项目算法的一个很好的样例,对之后的类似的匹配性的算法模型提供很好设计思路。
- 使用bokeh可以根据分析要求绘制更加复杂的图形,例如本项目中的两个图形,这是matplotlib和seaborn所不具备特征。


