【Matlab自学】第五章图形绘制_常用图形的绘制:点线面
第五章 图形绘制
*本节介绍点线面的基本绘制方式 *
常用图形的绘制
绘制点
plot(x,y)
plot(10,10,'b*')
绘制直线
line()函数用于绘制直线
语法如下
- line
在当前轴中绘制直线,默认值为 x=[0 1],y=[0 1] - line(x,y)
在当前轴中按向量x,y绘制直线,如果x,y是大小相同矩阵,则每一列绘制一条 - line(x,y,z)
按三维坐标绘制直线 - line(x,y,z,‘PropertyName’,PropertyValue)
- line(‘xData’,x,‘yData’,y,…)
低层绘制直线函数 - h = line([…])
返回图形句柄h
e.g
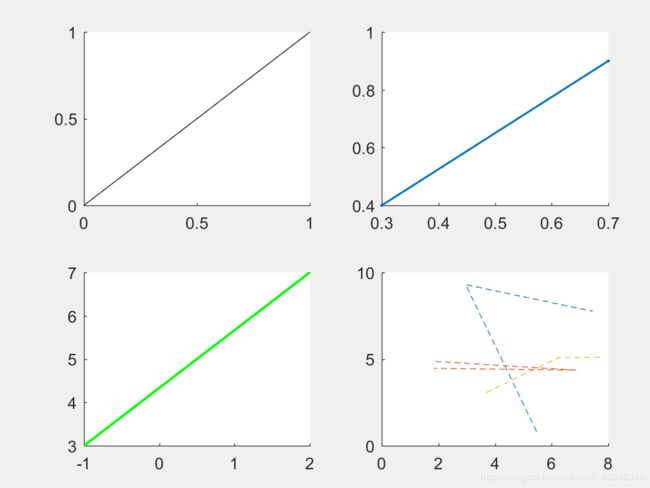
close all
subplot(221)
line;
subplot(222)
line([.3 .7],[.4 .9],[1 3],'Marker','.','LineStyle','-','LineWidth',1.2)
subplot(223)
line([-1  2],[3 7],'Linewidth',1.5,'color','g')
subplot(224)
x4 = 10*rand(3,3);
y4 = 10*rand(3,3);
line(x4,y4,'LineStyle','- -')
绘制面
rectangle()
fill()
area()
rectangle()
- rectangle()
以位置属性为[0,0,1,1]和曲线属性为[0,0] (无曲线)绘制矩形 - rectangle(‘Position’,[x ,y ,w ,h])
从(x,y)点开始画到(w,h)结束 - rectangle(‘Curvaturn’,[x,y])
Curvaturn[x,y]的x,y取不同的值可以画出多种图形[0,0] 矩形 [1,1] 椭圆
e.g
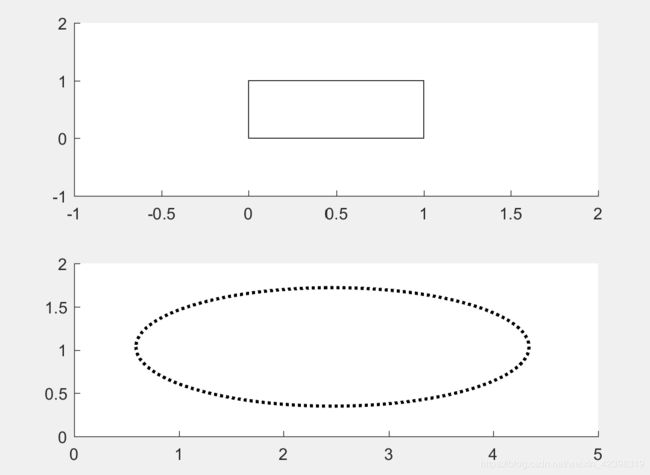
hold off
close all
subplot(211)
rectangle();
xlim([-1, 2]);
ylim([-1, 2]);

subplot(212)
rectangle('Position',[0.59,0.35,3.75,1.37],...
          'Curvature',[1,1],...
          'LineWidth',2,'LineStyle',':')
xlim([0, 5]);
ylim([0, 2]);
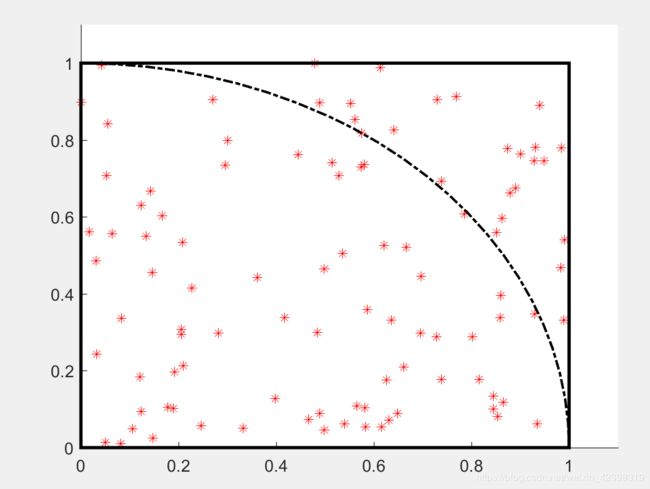
close all
hold on
x = rand(1,100);
y = rand (1,100);
plot(x,y,'*r')
rectangle('Position',[0,0,1,1],'Linewidth',2,'LineStyle','-')
rectangle('Position',[-1,-1,2,2],'curvature',[1,1],'LineStyle','-.','Linewidth',1.5)
xlim([0, 1.1]);
ylim([0, 1.1]);
填充 图形
fill()
使用fill()可以绘制填充图,产生一个或多个2D多边形的填充区域
fill([x a],[y b],'color')
a,b是x,y衍生的方向,x,y,a,b构成多边形
我们通过一个例子来学习使用
e.g
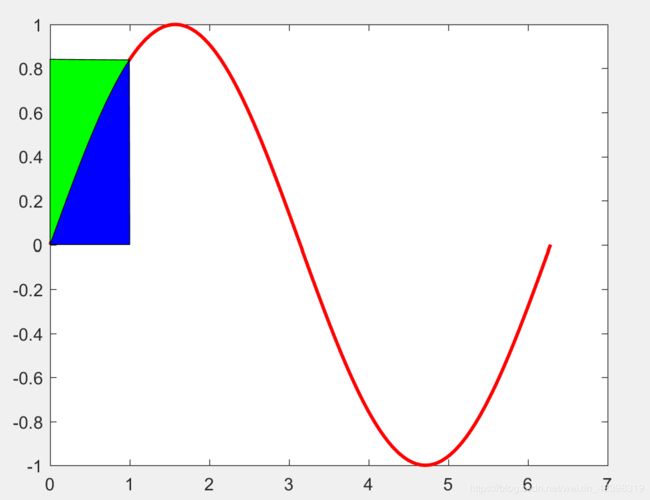
hold off
x=0:pi/60:2*pi;
y=sin(x);
x1=0:pi/60:1;
y1=sin(x1);
plot(x,y,'r','LineWidth',2);
hold on
fill([x1 1],[y1 0],'b')
fill([x1 0],[y1 sin(1)],'g')
area()
area(y)
%绘制向量y或矩阵y的各列的和
area(x,y)
%若x,y是向量,则以x的元素为横坐标,以y的元素为纵坐标绘制图像,并填充线条与x轴之间的空间
%若y是矩阵,则绘制y每一列的和
area(...,baseValue)
%baseValue为每一次填充的底值,默认为0
e.g
hold off
close all
clear
x = 0:.01:4*pi;  %// x data
y = sin(x);      %// y data
subplot(221)
level = 0.5;     %// level
plot(x, y)
hold on
area(x, max(y, level), level, 'EdgeColor', 'r', 'FaceColor', [.7 .7 .9])

subplot(222)
level = -0.5;     %// level
plot(x, y)
hold on
area(x,min(y, level), level, 'EdgeColor', 'k', 'FaceColor', [.7 .9 .7])

subplot(223)
area(x,y, 'FaceColor', [.7 .4 .9])
subplot(224)
y = [sin(x),cos(x)];
area(y, 'FaceColor', [.1 .7 .9])
下一节我们将介绍介绍柱状图和饼状图这两种特殊图形的绘制,以及三维图像的绘制


