特征工程前的数据可视化技巧
以泰坦尼克乘客生还数据为例。
读取数据后:
data.head()
data.describe()
data.info()
观察数据大概情况。
plt.figsize=(16,8)
sns.countplot('Survived',data=data)
plt.title('Survived')
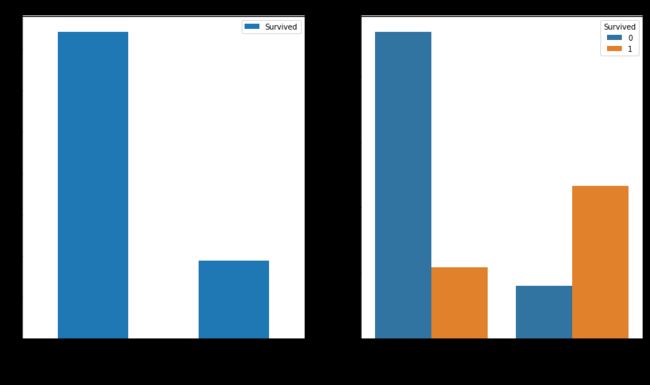
f,ax=plt.subplots(1,2,figsize=(18,8))

data[['Sex','Survived']].groupby(['Sex']).mean().plot.bar(ax=ax[0])
ax[0].set_title('Sex vs Survived')

sns.countplot('Sex',hue='Survived',data=data,ax=ax[1])
ax[1].set_title('Sex:Survived or dead')
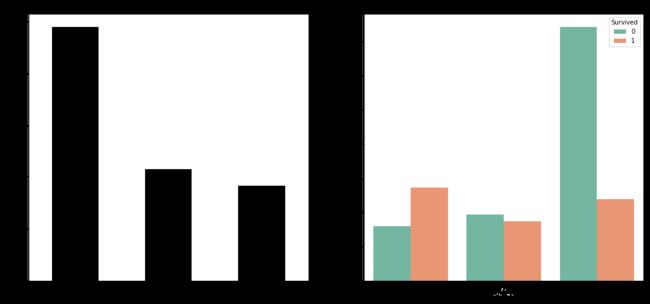
f,ax=plt.subplots(1,2,figsize=(18,8))

data['Pclass'].value_counts().plot.bar(color='Black',ax=ax[0])
ax[0].set_title('Pclass vs Survived')
ax[0].set_ylabel('Count')

sns.countplot('Pclass',hue='Survived',data=data,ax=ax[1],palette='Set2')
ax[1].set_title('Pclass:Survived or dead')
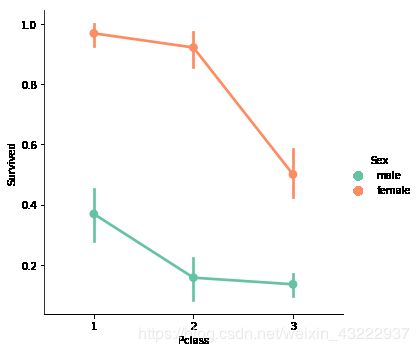
sns.factorplot('Pclass','Survived',hue='Sex',data=data,palette='Set2')
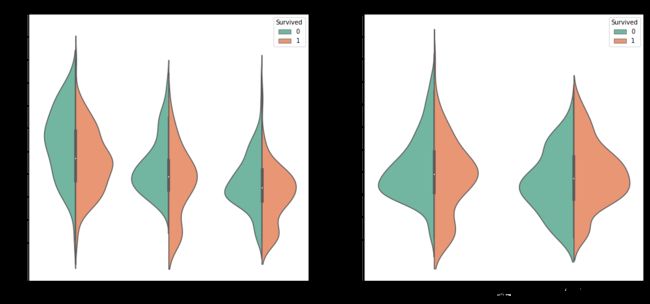
f,ax=plt.subplots(1,2,figsize=(18,8))

sns.violinplot('Pclass','Age',hue='Survived',split=True,data=data,ax=ax[0],palette='Set2')
ax[0].set_title('Pclass and Age vs Survived')
ax[0].set_yticks(range(0,110,10))

sns.violinplot('Sex','Age',hue='Survived',split=True,data=data,ax=ax[1],palette='Set2')
ax[1].set_title('Sex and Age vs Survived')
ax[1].set_yticks(range(0,110,10))
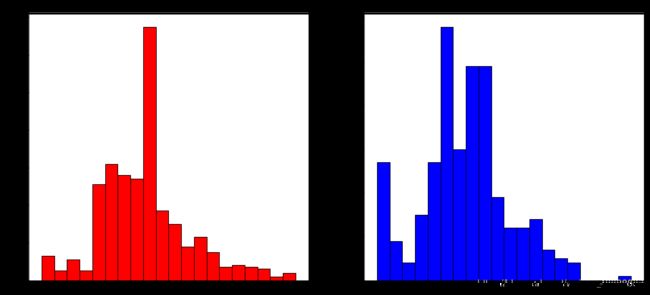
f,ax=plt.subplots(1,2,figsize=(18,8))

data[data['Survived']==0].Age.plot.hist(bins=20,ax=ax[0],edgecolor='black',color='red')
ax[0].set_title('Survived=0')
x1=list(range(0,85,5))

data[data['Survived']==1].Age.plot.hist(bins=20,ax=ax[1],edgecolor='black',color='blue')
ax[1].set_title('Survived=1')
x2=list(range(0,85,5))
sns.factorplot('Embarked','Survived',data=data)
f,ax=plt.subplots(2,2,figsize=(20,15))

sns.countplot('Embarked',data=data,ax=ax[0,0],palette='Set2')
ax[0,0].set_title('NO. of passengers boarded')

sns.countplot('Embarked',hue='Sex',data=data,ax=ax[0,1],palette='Set2')
ax[0,1].set_title('Male-Female split for embarked')

sns.countplot('Embarked',hue='Survived',data=data,ax=ax[1,0],palette='Set2')
ax[1,0].set_title('Embarked vs Survived')

sns.countplot('Embarked',hue='Pclass',data=data,ax=ax[1,1],palette='Set2')
ax[1,1].set_title('Embarked vs Pclass')

plt.subplots_adjust(wspace=0.3,hspace=0.3)
sns.factorplot('Pclass','Survived',hue='Sex',col='Embarked',data=data)
facet = sns.FacetGrid(data,hue = 'Survived',aspect=3)  #给FacetGrid传入原始数据,按hue进行分类
facet.map(sns.kdeplot,'Fare',shade = True)
facet.set(xlim=(data['Fare'].min(),data['Fare'].max()))
facet.add_legend()  #add_legend 添加图例

