kaggle上面的E-Commerce Data数据集练习(可视化与部分特征工程)
接上篇:
https://editor.csdn.net/md/?articleId=103394900
集体换个列名
data = data.rename(index=str, columns={'InvoiceNo': 'invoice_num',
                              'StockCode' : 'stock_code',
                              'Description' : 'description',
                              'Quantity' : 'quantity',
                              'InvoiceDate' : 'invoice_date',
                              'UnitPrice' : 'unit_price',
                              'CustomerID' : 'cust_id',
                              'Country' : 'country'})
Part 2 可视化及进一步数据分析
一种处理时间数据的方法
data.insert(loc = 2, column='year_month',value=data['InvoiceDate'].map(lambda x:100*x.year+x.month))
data.insert(loc = 3, column='month',value=data.InvoiceDate.dt.month)
data.insert(loc=4,column='day',value=(data['InvoiceDate'].dt.dayofweek)+1)## +1 to make Monday=1.....until Sunday=7
data.insert(loc=5,column='hour',value=data.InvoiceDate.dt.hour)
print(data.head())
学习点:
如何插入新行,以及其赋值方式。
时间的一些函数。
data['InvoiceDate'].map(lambda x:100*x.year+x.month))
给每一行映射,得到整型。
print(data.info())

year_month     391183 non-null int64
month          391183 non-null int64
day            391183 non-null int64
输出每一列包含多少种特征
def unique_count(data):
    for i in data.columns:
        count = data[i].nunique()
        print(i,";",count)
unique_count(data)
OUT:
invoice_num ; 18405
stock_code ; 3659
year_month ; 13
month ; 12
day ; 6
hour ; 15
description ; 3871
quantity ; 300
invoice_date ; 17169
unit_price ; 356
cust_id ; 4335
country ; 37
一些可视化
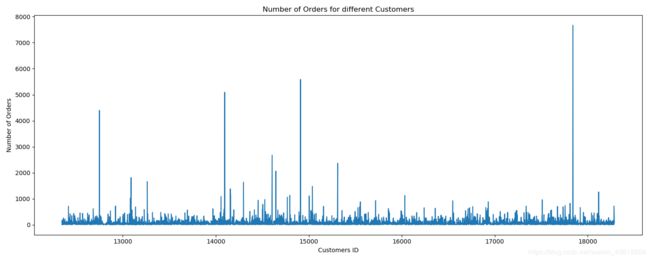
序列特征( cust_id ),类别特征(country)和数值特征(invoice_num)的关系
orders = data.groupby(by=['cust_id','country'],as_index=False)['invoice_num'].count()
print(orders.head())
plt.subplots(figsize=(15,6))
plt.plot(orders.cust_id, orders.invoice_num)#消费者id与购买量的关系
plt.xlabel('Customers ID')
plt.ylabel('Number of Orders')
plt.title('Number of Orders for different Customers')
plt.show()
OUT:
   cust_id         country  invoice_num
0    12346  United Kingdom            1
1    12347         Iceland          182
2    12348         Finland           27
3    12349           Italy           72
4    12350          Norway           16
print('The TOP 5 customers with most number of orders...')
print(orders.sort_values(by='invoice_num',ascending=False).head())
      cust_id         country  invoice_num
4016    17841  United Kingdom         7667
1888    14911            EIRE         5586
1298    14096  United Kingdom         5095
334     12748  United Kingdom         4397
1670    14606  United Kingdom         2674
在类别特征下数值特征的分布
每个月多少订单?
原先的方法
out = data[['invoice_num','year_month']].groupby('year_month').count().sort_values('invoice_num', ascending=False)
根据之前的文章:Pandas的count()与value_counts()区别这里统计的其实是year_month在invoice_num里不为零值的次数。
先试试
out = data.groupby('invoice_num')['year_month'].value_counts().sort_index()
print(out)
OUT:
invoice_num  year_month
536365       201012         7
536366       201012         2
536367       201012        12
536368       201012         4
536369       201012         1
Name: year_month, dtype: int64
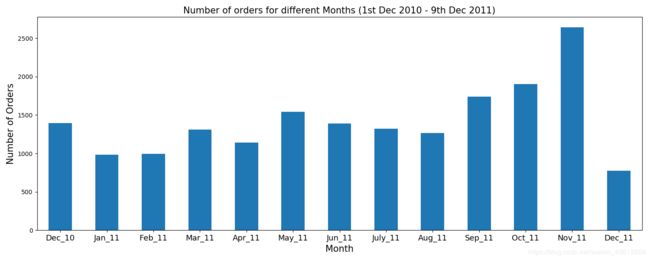
统计不同月份卖的数量
out = data.groupby('invoice_num')['year_month'].unique().value_counts().sort_index()
作图:
ax = data.groupby('invoice_num')['year_month'].unique().value_counts().sort_index().plot('bar',figsize=(15,6))

ax.set_xlabel('Month',fontsize=15)
ax.set_ylabel('Number of Orders',fontsize=15)
ax.set_title('Number of orders for different Months (1st Dec 2010 - 9th Dec 2011)',fontsize=15)
ax.set_xticklabels(('Dec_10','Jan_11','Feb_11','Mar_11','Apr_11','May_11','Jun_11','July_11','Aug_11','Sep_11','Oct_11','Nov_11','Dec_11'), rotation='horizontal', fontsize=13)
plt.show()
可以看出,11月份销量最高。
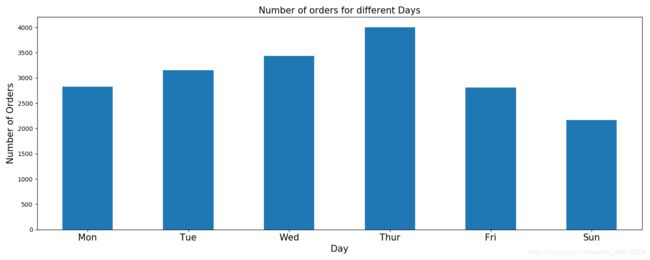
哪天(day)卖得最好(invoice_num)?
同样的方法
ax = data.groupby('invoice_num')['day'].unique().value_counts().sort_index().plot('bar',figsize=(15,6))
ax.set_xlabel('Day',fontsize=15)
ax.set_ylabel('Number of Orders',fontsize=15)
ax.set_title('Number of orders for different Days',fontsize=15)
ax.set_xticklabels(('Mon','Tue','Wed','Thur','Fri','Sun'), rotation='horizontal', fontsize=15)
plt.show()
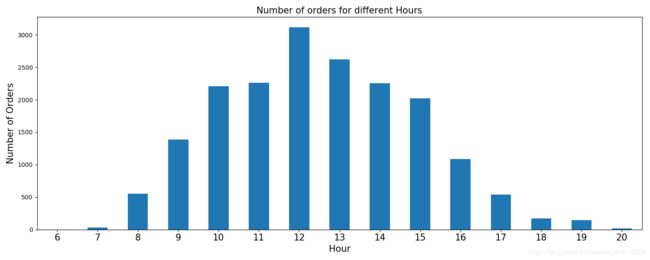
哪个小时(hour)卖得最好(invoice_num)?
out = data.groupby('invoice_num')['hour'].unique().value_counts()
print(out)
[12]        3117
[13]        2624
[11]        2261
[14]        2252
[10]        2204
[15]        2022
[9]         1383
[16]        1088
[8]          554
[17]         539
[18]         169
[19]         143
[7]           29
[20]          18
[6]            1
[11, 12]       1
最后一段有点问题。去掉。用iloc[:-1]。
out = data.groupby('invoice_num')['hour'].unique().value_counts().iloc[:-1].sort_index()
print(out)
[6]        1
[7]       29
[8]      554
[9]     1383
[10]    2204
[11]    2261
[12]    3117
[13]    2624
[14]    2252
[15]    2022
[16]    1088
[17]     539
[18]     169
[19]     143
[20]      18
OK,老办法画图。
ax = data.groupby('invoice_num')['hour'].unique().value_counts().iloc[:-1].sort_index().plot('bar',figsize=(15,6))
ax.set_xlabel('Hour',fontsize=15)
ax.set_ylabel('Number of Orders',fontsize=15)
ax.set_title('Number of orders for different Hours',fontsize=15)
ax.set_xticklabels(range(6,21), rotation='horizontal', fontsize=15)
plt.show()
连续值特征——价格(Unit Price)
print(data.unit_price.describe())
count    391183.000000
mean          2.874130
std           4.284639
min           0.000000
25%           1.250000
50%           1.950000
75%           3.750000
max         649.500000
Name: unit_price, dtype: float64
作一个分布图。
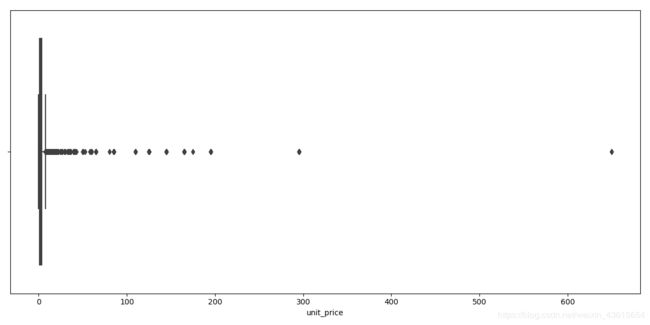
plt.subplots(figsize=(12,6))
sns.boxplot(data.unit_price)
plt.show()
查看免费的
data_free = data[data['unit_price']==0]
print(data_free)
订单按照国家(类别)分布
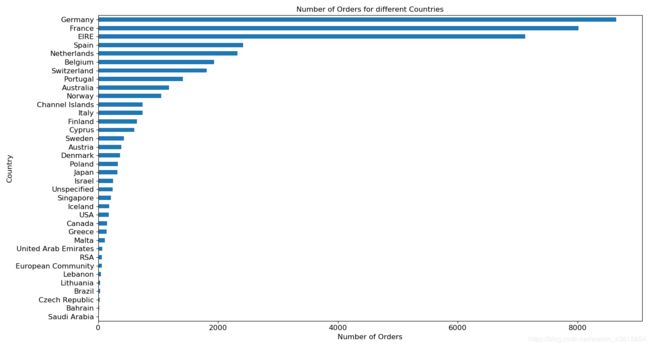
group_country_orders = data.groupby('country')['invoice_num'].count().sort_values()
plt.subplots(figsize=(15,8))
group_country_orders.plot('barh', fontsize=12)
plt.xlabel('Number of Orders', fontsize=12)
plt.ylabel('Country', fontsize=12)
plt.title('Number of Orders for different Countries', fontsize=12)
plt.show()
从上面count的用法来看,
group_country_orders = data.groupby('country')['invoice_num'].count().sort_values()
统计的是国家里的类别(UK,GERMANY…)在invoice_num出现的不为零的频次。
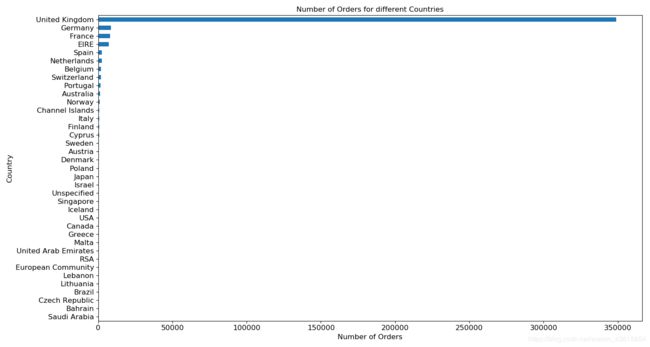
英国一骑当先。
去掉UK。画出其他国家的销量。
del group_country_orders['United Kingdom']
group_country_orders = data.groupby('country')['invoice_num'].count().sort_values()
del group_country_orders['United Kingdom']


plt.subplots(figsize=(15,8))
group_country_orders.plot('barh', fontsize=12)
plt.xlabel('Number of Orders', fontsize=12)
plt.ylabel('Country', fontsize=12)
plt.title('Number of Orders for different Countries', fontsize=12)
plt.show()
特征工程
1.总价计算
data['amount_spent'] = data['quantity']*data['unit_price']
print(data.amount_spent)
Out:
data['amount_spent'] = data['quantity']*data['unit_price']
print(data.sort_values(by='amount_spent',ascending=False).head())
       invoice_num stock_code  year_month  month  day  hour                          description  quantity        invoice_date  unit_price  cust_id         country  amount_spent
540421      581483      23843      201112     12    5     9          paper craft , little birdie     80995 2011-12-09 09:15:00        2.08    16446  United Kingdom     168469.60
61619       541431      23166      201101      1    2    10       medium ceramic top storage jar     74215 2011-01-18 10:01:00        1.04    12346  United Kingdom      77183.60
222680      556444      22502      201106      6    5    15       picnic basket wicker 60 pieces        60 2011-06-10 15:28:00      649.50    15098  United Kingdom      38970.00
348325      567423      23243      201109      9    2    11  set of tea coffee sugar tins pantry      1412 2011-09-20 11:05:00        5.06    17450  United Kingdom       7144.72
52711       540815      21108      201101      1    2    12   fairy cake flannel assorted colour      3114 2011-01-11 12:55:00        2.10    15749  United Kingdom       6539.40
作图:
revenue_per_countries = data.groupby(["country"])["amount_spent"].sum().sort_values()
revenue_per_countries.plot(kind='barh',figsize=(15,12))
plt.title("Revenue per Country")
plt.grid()#画出网格线
plt.show()
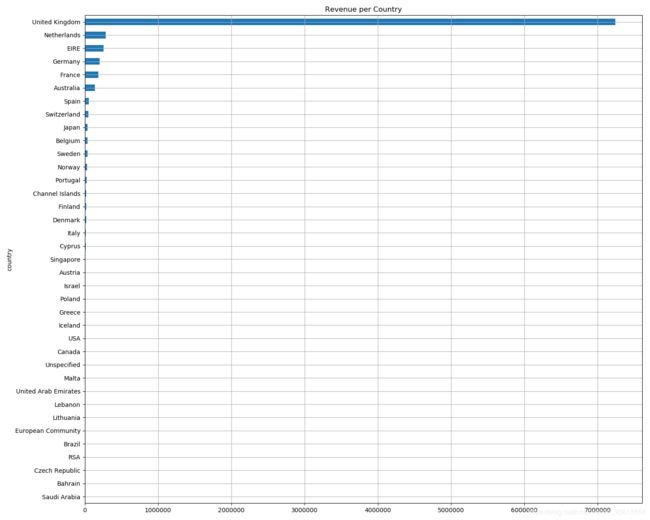
各国的购买数量(类别和数值型):
参照Pandas的count()与value_counts()区别
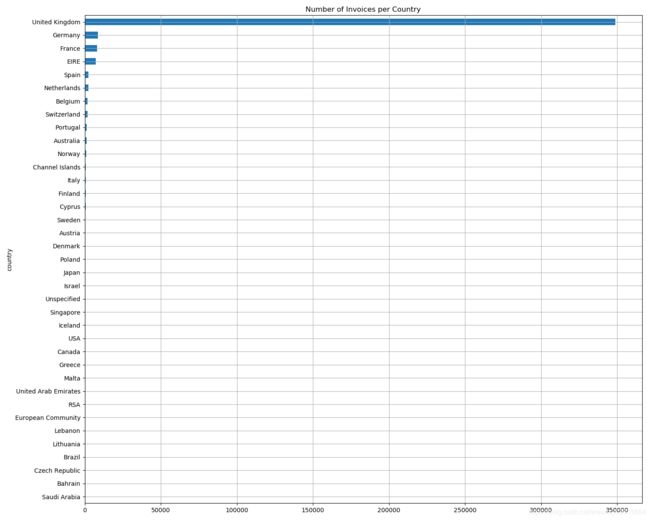
No_invoice_per_country = data.groupby(["country"])["invoice_num"].count().sort_values()
No_invoice_per_country.plot(kind='barh', figsize=(15,12))
plt.title("Number of Invoices per Country")
plt.grid()
plt.show()
特征工程
类别特征(‘Country’)的处理
把类别标签转换为分类数值(LabelEncoer)
le = LabelEncoder().fit(data.country)
classes = le.classes_
print(classes)
print(len(classes))
['Australia' 'Austria' 'Bahrain' 'Belgium' 'Brazil' 'Canada'
 'Channel Islands' 'Cyprus' 'Czech Republic' 'Denmark' 'EIRE'
 'European Community' 'Finland' 'France' 'Germany' 'Greece' 'Iceland'
 'Israel' 'Italy' 'Japan' 'Lebanon' 'Lithuania' 'Malta' 'Netherlands'
 'Norway' 'Poland' 'Portugal' 'RSA' 'Saudi Arabia' 'Singapore' 'Spain'
 'Sweden' 'Switzerland' 'USA' 'United Arab Emirates' 'United Kingdom'
 'Unspecified']
37
打上数字标签
l = [i for i in range(37)]
dict(zip(list(classes),l))
看看转换后的数字标签
country2 = pd.Series(dict(zip(list(classes),l)))
print(country2)
Australia                0
Austria                  1
Bahrain                  2
Belgium                  3
Brazil                   4
Canada                   5
Channel Islands          6
Cyprus                   7
Czech Republic           8
Denmark                  9
EIRE                    10
European Community      11
Finland                 12
France                  13
Germany                 14
Greece                  15
Iceland                 16
Israel                  17
Italy                   18
Japan                   19
Lebanon                 20
Lithuania               21
Malta                   22
Netherlands             23
Norway                  24
Poland                  25
Portugal                26
RSA                     27
Saudi Arabia            28
Singapore               29
Spain                   30
Sweden                  31
Switzerland             32
USA                     33
United Arab Emirates    34
United Kingdom          35
Unspecified             36
dtype: int64
时间特征(另一种处理方式)
使用map和lambda
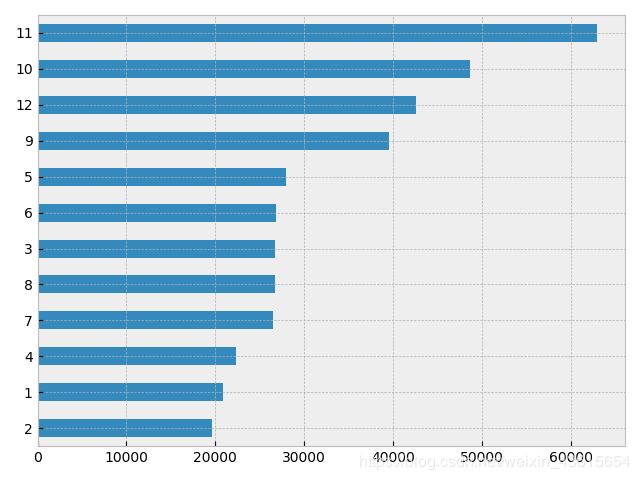
data['Month'] = data['invoice_date'].map(lambda x:x.month)
data['Month'].value_counts().sort_values().plot('barh')
plt.show()
其他时间参数用同样的方式处理:
data['Month'] = data['invoice_date'].map(lambda x:x.month)
data['Weekday'] = data["invoice_date"].map(lambda x: x.weekday())
data['Day'] = data["invoice_date"].map(lambda x: x.day)
data['Hour'] = data["invoice_date"].map(lambda x: x.hour)

print(data.head())
    invoice_num stock_code  year_month  month  day  hour                          description  quantity        invoice_date  unit_price  cust_id  country  amount_spent  Month  Weekday  Day  Hour
0      536365     85123A      201012     12    3     8   white hanging heart t-light holder         6 2010-12-01 08:26:00        2.55    17850       35         15.30     12        2    1     8
1      536365      71053      201012     12    3     8                  white metal lantern         6 2010-12-01 08:26:00        3.39    17850       35         20.34     12        2    1     8
2      536365     84406B      201012     12    3     8       cream cupid hearts coat hanger         8 2010-12-01 08:26:00        2.75    17850       35         22.00     12        2    1     8
3      536365     84029G      201012     12    3     8  knitted union flag hot water bottle         6 2010-12-01 08:26:00        3.39    17850       35         20.34     12        2    1     8
4      536365     84029E      201012     12    3     8       red woolly hottie white heart.         6 2010-12-01 08:26:00        3.39    17850       35         20.34     12        2    1     8
