IRI-2016 Matlab 使用教程
IRI2016在线计算模型:(https://ccmc.gsfc.nasa.gov/modelweb/models/iri2016_vitmo.php)
同时IRI2016还有Matlab和Fortran版本,其中的Matlab也是通过在线的接口进行计算的(Fortran没用不知道,猜测也是这样的),不使用线下的好处在于自己可以批量指定范围,这样更加方便,下面介绍如果下载何和使用Matlab版的IRI2016。
1. 下载
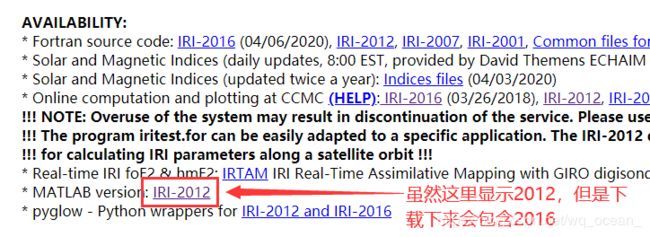
网址:http://irimodel.org/
下载需要注册账号,没有注册账号的自行注册,下载好后解压是这样的:
iri2016.m的运行需要一个网络传输工具-curl,iri2016.m代码里面有提到,curl下载网址:https://curl.haxx.se/windows/,我这里使用window系统,下载后解压,将bin目录下的curl.exe复制到与iri2016.m的相同路径
2. 运行
iri2016.m本身有一点bug,运行它给的测试代码iritest.m会报错,一番摸索后将iri2016.m最后一行代码
data = sscanf(result(newlines(246)+1 : newlines(246 + sweeplen)-1), '%f');
替换成
data = sscanf(result(newlines(248)+1 : newlines(248 + sweeplen)-1), '%f');iri2016.m代码里面有使用并行工具requires Parallel Computing Toolbox,我们没有,我们使用常规循环的方式单线程运行就好,我把iri2016.m里的代码精简一下如下:
% IRITEST Plot electron density around the world to test IRI functions.

%% Clear variables and close all figures.
tic;
clc;
clear;
close all;

%% Test values.
time = datenum([2012 7 17 12 0 0]); % Must be a scalar in this script.
latitude = -90:1:90;    % Degrees. Can be a vector or scalar.
longitude = -180:1:180; % Degrees. Can be a vector or scalar.
altitude = 100;         % km. Must be a scalar in this script.
fun2test = @iri2016; % Either @iri2012 or @iri2016.

Ne = zeros(numel(latitude), numel(longitude));


    % Index into the vector (latitude or longitude) with fewer elements.
    if numel(latitude) >= numel(longitude)% || altitude ~= 100
        latitude = latitude(:); N = numel(longitude);
        for index = 1:N
            out = fun2test(time, latitude, longitude(index), altitude);
            Ne(:, index) = out(:, 1);
            fprintf('%4.4g%% Complete\n', index/N*100);
        end
    else
        longitude = longitude(:); N = numel(latitude);
        for index = 1:N
            out = fun2test(time, latitude(index), longitude, altitude);
            Ne(index, :) = out(:, 1).';
            fprintf('%4.4g%% Complete\n', index/N*100);
        end
    end


%% Plot data.
figure;
if ~license('test', 'MAP_Toolbox')
    hold on;
    % surf(LON.', LAT.', B.'); %decl
    surf(longitude, latitude, Ne);
    colormap(jet(64));
    shading flat;
    clim = get(gca, 'CLim'); zlim = get(gca, 'ZLim');
    load('topo.mat', 'topo'); topo = [topo(:, 181:360), topo(:, 1:180)];
    [C, h] = contour3(-180:179, -90:+89, topo + zlim(2), [0 0] + zlim(2));
    set(h, 'EdgeColor', 0.25*[1 1 1]);
    set(gca, 'XLim', [-180 180], 'XTick', [], ...
        'YLim', [-90 90], 'YTick', [], 'CLim', clim);
else
    axesm miller; axis fill;
    hold on;
    % surfm(LAT, LON, B); %decl
    surfm(latitude, longitude, Ne);
    load coast;
    plotm(lat, long, 'Color', 0.25*[1 1 1]);
end
hc = colorbar;
title(hc, '\itN_e\rm in m^{-3}');
% title(['Magnetic Field Declination in degrees at \ith\rm = ' ...
%     sprintf('%g km', altitude) ' at ' datestr(time) ' UTC']);
title(['Electron Density (\itN_e\rm) at \ith\rm = ' ...
    sprintf('%g km', altitude) ' at ' datestr(time) ' UTC']);
print -dpng -r100 iri.png

%%
toc;
自己新建一个m文件把代码复制进去运行,运行时间为:
![]()
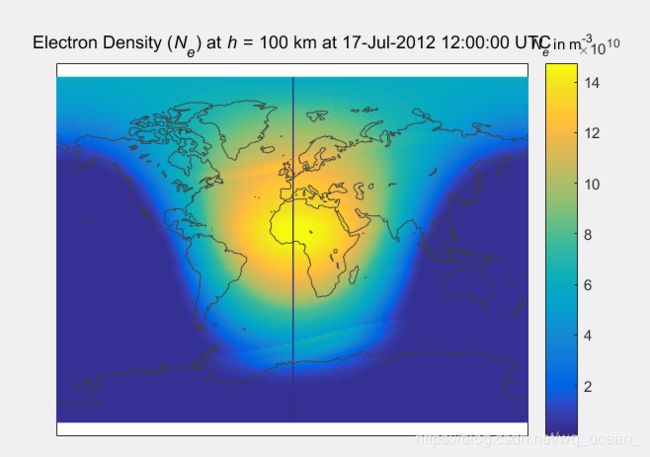
最终结果:


