泰坦尼克号数据分析
案例:泰坦尼号数据分析
背景:
泰坦尼克号的沉没是历史上最臭名昭着的沉船之一。1912年4月15日,在首次航行期间,泰坦尼克号撞上冰山后沉没,2224名乘客和机组人员中有1502人遇难。这场轰动的悲剧震撼了国际社会,并导致了更好的船舶安全条例。
海难导致生命损失的原因之一是没有足够的救生艇给乘客和机组人员。虽然幸存下来的运气有一些因素,但一些人比其他人更有可能生存,比如妇女,儿童和上层阶级。
数据集描述
数据中的特征共有11个,它们分别是:
Survived:0代表死亡,1代表存活
Pclass:乘客所持票类,有三种值(1,2,3)
Name:乘客姓名
Sex:乘客性别
Age:乘客年龄(有缺失)
SibSp:乘客兄弟姐妹/配偶的个数(整数值)
Parch:乘客父母/孩子的个数(整数值)
Ticket:票号(字符串)
Fare:乘客所持票的价格(浮点数,0-500不等)
Cabin:乘客所在船舱(有缺失)
Embark:乘客登船港口:S、C、Q(有缺失)
各特征与存活的关系分析
读取数据并查看数据格式
import numpy as np
import pandas as pd
import matplotlib.pyplot as plt
import seaborn as sns

train=pd.read_csv('train.csv')
train=pd.DataFrame(train,columns=['PassengerId','Pclass','Name','Sex','Age','SibSp','Parch','Ticket','Fare','Cabin','Embarked','Survived'])
train.head()
Pclass特征分析
利用饼图分别求出Pclass的类别(1、2、3)与人员存活之间的比例,思路是:求出Pclass为1、2、3,而且存活和死亡的人数,再进行比较,最后用饼图清晰表示出来。
Pclass1_survived_number=train.loc[(train['Pclass']==1)&(train['Survived']==1)]['Pclass'].count()  #类别为1且存活的人数数量
Pclass1_unsurvived_number=train.loc[(train['Pclass']==1)&(train['Survived']==0)]['Pclass'].count() #类别为1且死亡的人数数量
Pclass2_survived_number=train.loc[(train['Pclass']==2)&(train['Survived']==1)]['Pclass'].count() #类别为2且存活的人数
Pclass2_unsurvived_number=train.loc[(train.Pclass==2)&(train.Survived==0)]['Pclass'].count()#类别为2,死亡的人数
Pclass3_survived_number=train.loc[(train['Survived']==1)&(train['Pclass']==3)]['Pclass'].count()  #类别为3,存活的人数
Pclass3_unsurvived_number=train.loc[(train['Pclass']==3)&(train.Survived==0)]['Pclass'].count() #类别为3,死亡的人数

pu1=(Pclass1_unsurvived_number)/(Pclass1_unsurvived_number+Pclass1_survived_number)
ps1=(Pclass1_survived_number)/(Pclass1_unsurvived_number+Pclass1_survived_number)
pu2=(Pclass2_unsurvived_number)/(Pclass2_unsurvived_number+Pclass2_survived_number)
ps2=(Pclass2_survived_number)/(Pclass2_unsurvived_number+Pclass2_survived_number)
pu3=(Pclass3_unsurvived_number)/(Pclass3_unsurvived_number+Pclass3_survived_number)
ps3=(Pclass3_survived_number)/(Pclass3_unsurvived_number+Pclass3_survived_number)

colors=['red','green']
plt.figure(figsize=(8,2))
plt.subplot(131)
plt.pie([pu1,ps1],colors=colors,autopct='%1.1f%%',explode=[0.04,0.04],labels=['Unsurvived','Survived'])
plt.title('Pclass_1')

plt.subplot(132)
plt.pie([pu2,ps2],colors=colors,autopct="%1.1f%%",explode=[0.04,0.04],labels=['Unsurvived','Survived'])
plt.title('Pclass_2')

plt.subplot(133)
plt.pie([pu3,ps3],colors=colors,autopct='%1.1f%%',explode=[0.04,0.04],labels=['Unsurvived','Survived'])
plt.title('Pclass_3')


plt.show()

分析:从图中可以清楚地看出Pclass类别为3的死亡人数最高,高达75.8%,其次就是类别为2,其死亡率高达52.7%,死亡最少的类别为1,其死亡人数不到一半。
Name特征分析
因为存活率和名字无关,因此Name特征不做分析。
Sex特征分析
M_S=train.loc[(train.Sex=='male')&(train.Survived==1)]['Sex'].count()  #男性存活人数
M_U=train.loc[(train.Sex=='male')&(train.Survived==0)]['Sex'].count()  #男性死亡人数
F_S=train.loc[(train.Sex=='female')&(train.Survived==1)]['Sex'].count()  #女性存活人数
F_U=train.loc[(train.Sex=='female')&(train.Survived==0)]['Sex'].count() #女性死亡人数
all_M=train.loc[train.Sex=='male']['Sex'].count() #所有男性人数
all_F=train.loc[train.Sex=='female']['Sex'].count()  #所有女性人数

p1=[M_S/all_M,M_U/all_M]  #存活男性和死亡男性在所有男性所占的概率
p2=[F_S/all_F,F_U/all_F]  #存活女性和死亡女性在所有女性所占的概率

plt.figure(figsize=(6,2))
colors=['green','red']
plt.subplot(121)
plt.pie(p1,colors=colors,explode=[0.04,0.04],labels=['Survived','Unsurvived'],autopct='%1.1f%%')
plt.title('Male')
plt.subplot(122)
plt.pie(p2,colors=colors,explode=[0.04,0.04],labels=['Survived','Unsurvived'],autopct='%1.1f%%')
plt.title('Female')
plt.show()
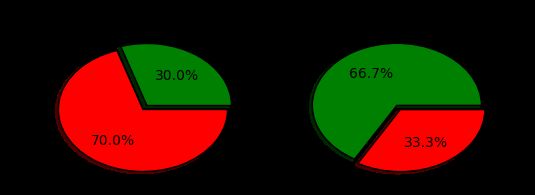
分析:由图可知,男性死亡人数远远高于女性。导致这种情况的原因可能是出现危险时,男性都愿意保护女性,或者男性相信自己的游泳技术,从而不找任何漂浮物跳下船舱。
Age特征分析
(1)Age特征存在缺失值,且一个人的年龄不能利用均值、方差等来填充,因此第一种分析分为有年龄特征的分析和无年龄特征的分析
A_S=train.loc[(train['Age'].notnull())&(train.Survived==1)]['Age'].count()  #有年龄特征且存活的数量
A_U=train.loc[(train.Age.notnull())&(train.Survived==0)]['Age'].count()  #有年龄特征且死亡的数量
Not_A_S=train.loc[(train.Age.isnull())&(train.Survived==1)]['Pclass'].count()  # 无年龄特征且存活的数量   #此句和下句的Pclass若改为Age,则显示结果为0,是因为isnull()的原因
Not_A_U=train.loc[(train.Age.isnull())&(train.Survived==0)]['Pclass'].count()  #无年龄特征且死亡的数量
all_A=train.loc[train.Age.notnull()]['Age'].count()  #所有有年龄特征的人数
all_Not_A=train.loc[train.Age.isnull()]['Pclass'].count() #所有无年龄特征的人数

p1=[A_S/all_A,A_U/all_A]  #有年龄特征存活和死亡的概率
p2=[Not_A_S/all_Not_A,Not_A_U/all_Not_A]  #无年龄特征存活和死亡的概率

plt.figure(figsize=(6,2))
plt.subplot(121)
colors=['green','red']
explode=[0.04,0.04]

plt.pie(p1,colors=colors,autopct='%1.1f%%',explode=explode,shadow=1,labels=['Age Survived','Age Unsurvived'])
plt.title('Age')

plt.subplot(122)
plt.pie(p2,colors=colors,autopct='%1.1f%%',explode=explode,shadow=1,labels=['Non-Age Survived','Non-Age Unsurvived'])
plt.title('Non-Age')

plt.show()

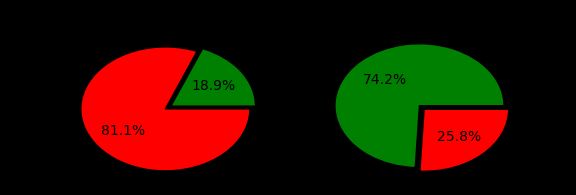
从图中看出无年龄特征的人数死亡率高于有年龄特征的人数。
(2)将有年龄特征的分为三组:未成年A(0-17),青年人B(18-65),老年人C(66-)
重新建立一个特征Rank,其值为A\B\C
#将有年龄特征分为ABC三组
train2=train.loc[train.Age.notnull()]
train2['Rank']=pd.cut(train2.Age,bins=[1,17,65,120],labels=['A','B','C'])
train2.head()
#利用堆积柱状图进行可视化
A_Sur=train2.loc[(train2.Rank=='A')&(train2.Survived==1)]['Rank'].count()   #未成年人生存的人数
A_Unsur=train2.loc[(train2.Rank=='A')&(train2.Survived==0)]['Rank'].count()    #未成年人死亡的人数
B_Sur=train2.loc[(train2.Rank=='B')&(train2.Survived==1)]['Rank'].count() #中年人生存的人数
B_Unsur=train2.loc[(train2.Rank=='B')&(train2.Survived==0)]['Rank'].count()   #中年人死亡的人数
C_Sur=train2.loc[(train2.Rank=='C')&(train2.Survived==1)]['Rank'].count()   #老年人生存的人数
C_Unsur=train2.loc[(train2.Rank=='C')&(train2.Survived==0)]['Rank'].count()   #老年人死亡的人数
a=[A_Unsur,B_Unsur,C_Unsur]
b=[A_Sur,B_Sur,C_Sur]

x=np.linspace(-0.5,1.7,3)

plt.bar(x,a,color='r',label='Unsurvived')
plt.bar(x,b,bottom=a,label='Survived',color='g')
plt.xticks(np.arange(3),('Young','Adult','Old'))
plt.xlabel('Type')
plt.ylabel('Number')
#显示范围
plt.xlim(-0.3,2.5)
plt.ylim(0,600)

#显示图例
plt.legend(loc='upper right')
plt.grid(axis='y', color='gray', linestyle=':', linewidth=2)
plt.show()
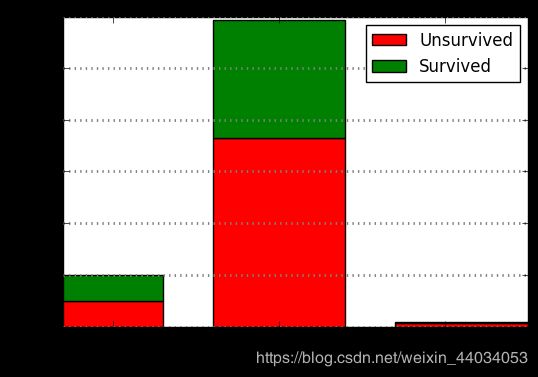
从图中看出:船上的成年人最多,未成年人其次,最少是老年人,而且老年人死亡率很高。
SibSp特征分析
本特征的分析,主要先查看SibSp的数据类型,再将各类的数据划分到不同的变量,再对各个变量进行存活率的比较
train.SibSp.unique()  #查看SibSp特征的情况

#将数据按照SibSp的类型拆分
s0=train.loc[train.SibSp==0]
s1=train.loc[train.SibSp==1]
s2=train.loc[train.SibSp==2]
s3=train.loc[train.SibSp==3]
s4=train.loc[train.SibSp==4]
s5=train.loc[train.SibSp==5]
s8=train.loc[train.SibSp==8]

#将每一个拆分后的数据集对存活和死亡的数量进行分析,利用堆积图可视化出来
s0_s=s0.loc[s0.Survived==1]['SibSp'].count()   #0特征的存活数量
s0_u=s0.loc[s0.Survived==0]['SibSp'].count()   #0特征的死亡数量

s1_s=s1.loc[s1.Survived==0]['SibSp'].count()
s1_u=s1.loc[s1.Survived==1]['SibSp'].count()

s2_s=s2.loc[s2.Survived==0]['SibSp'].count()
s2_u=s2.loc[s2.Survived==1]['SibSp'].count()

s3_s=s3.loc[s3.Survived==0]['SibSp'].count()
s3_u=s3.loc[s3.Survived==1]['SibSp'].count()

s4_s=s4.loc[s4.Survived==0]['SibSp'].count()
s4_u=s4.loc[s4.Survived==1]['SibSp'].count()

s5_s=s5.loc[s5.Survived==0]['SibSp'].count()
s5_u=s5.loc[s5.Survived==1]['SibSp'].count()

s8_s=s8.loc[s8.Survived==0]['SibSp'].count()
s8_u=s8.loc[s8.Survived==1]['SibSp'].count()

c=[s0_s,s1_s,s2_s,s3_s,s4_s,s5_s,s8_s]
d=[s0_u,s1_u,s2_u,s3_u,s4_u,s5_u,s8_u]

x=np.arange(7)
width=0.5
plt.bar(x,c,width,color='g',label='Survived')
plt.bar(x,d,width,bottom=c,color='r',label='Unsurvived')

plt.xticks(x,[0,1,2,3,4,5,8])
plt.xlabel('Type of SibSp')
plt.ylabel('Number of SibSp')
plt.legend(loc='upper right')

plt.show()
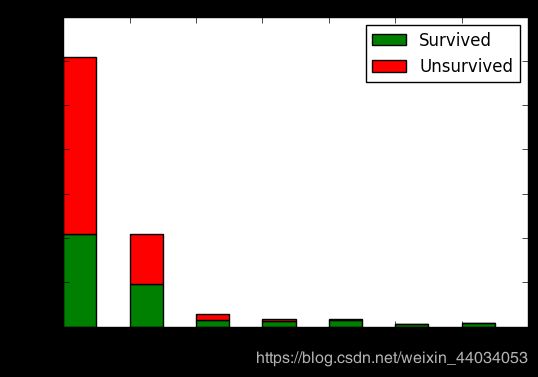
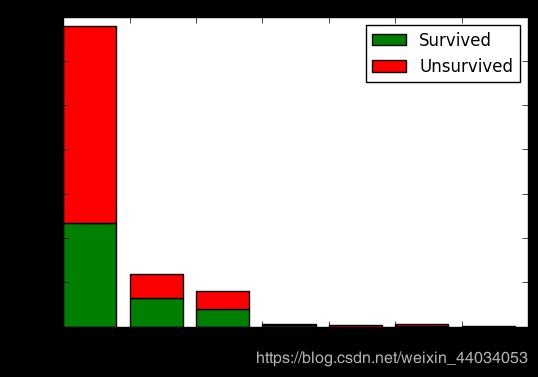
从图中看出,类型为0的特征人数最多,其次就是类型2的人数;相应的死亡人数也比其他特征要高很多。
Parch特征分析
利用相似的方法对Parch特征进行堆积图可视化。
train.Parch.unique()

P0_s=train.loc[(train.Parch==0)&(train.Survived==1)]['Parch'].count()
P0_u=train.loc[(train.Parch==0)&(train.Survived==0)]['Parch'].count()

P1_s=train.loc[(train.Parch==1)&(train.Survived==1)]['Parch'].count()
P1_u=train.loc[(train.Parch==1)&(train.Survived==0)]['Parch'].count()

P2_s=train.loc[(train.Parch==2)&(train.Survived==1)]['Parch'].count()
P2_u=train.loc[(train.Parch==2)&(train.Survived==0)]['Parch'].count()

P3_s=train.loc[(train.Parch==3)&(train.Survived==1)]['Parch'].count()
P3_u=train.loc[(train.Parch==3)&(train.Survived==0)]['Parch'].count()

P4_s=train.loc[(train.Parch==4)&(train.Survived==1)]['Parch'].count()
P4_u=train.loc[(train.Parch==4)&(train.Survived==0)]['Parch'].count()

P5_s=train.loc[(train.Parch==5)&(train.Survived==1)]['Parch'].count()
P5_u=train.loc[(train.Parch==5)&(train.Survived==0)]['Parch'].count()

P6_s=train.loc[(train.Parch==6)&(train.Survived==1)]['Parch'].count()
P6_u=train.loc[(train.Parch==6)&(train.Survived==0)]['Parch'].count()

m=[P0_s,P1_s,P2_s,P3_s,P4_s,P5_s,P6_s]
n=[P0_u,P1_u,P2_u,P3_u,P4_u,P5_u,P6_u]

h=np.arange(7)
plt.bar(h,m,color='g',label='Survived')
plt.bar(h,n,bottom=m,color='r',label='Unsurvived')
plt.xticks(h,[0,1,2,3,4,5,6])
plt.xlabel('Type of Parch')
plt.ylabel('Number of Parch')
plt.legend(loc='upper right')
plt.show()
Ticket特征分析
因为在数据中,Ticket特征提取不了有用的信息,故此特征不做分析。
Fare特征分析
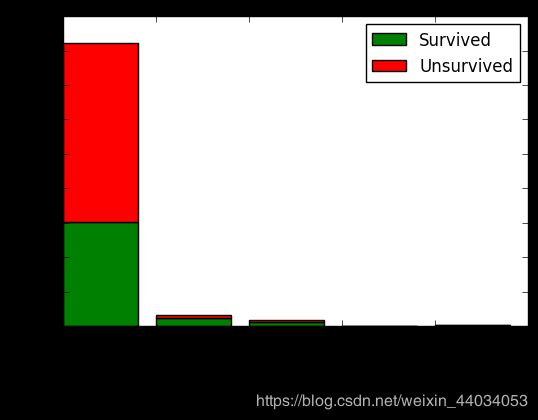
将Fare特征分为5个部分,然后分析各个部分的生存和死亡梳理,利用堆积图进行可视化
train_F=train

train_F['Rank']=pd.cut(train_F.Fare,bins=[0,100,200,300,400,550],labels=['A','B','C','D','E'])

a_s=train_F.loc[(train_F.Rank=="A")&(train_F.Survived==1)]['Rank'].count()
a_u=train_F.loc[(train_F.Rank=='A')&(train_F.Survived==0)]['Rank'].count()

b_s=train_F.loc[(train_F.Rank=="B")&(train_F.Survived==1)]['Rank'].count()
b_u=train_F.loc[(train_F.Rank=='B')&(train_F.Survived==0)]['Rank'].count()

c_s=train_F.loc[(train_F.Rank=="C")&(train_F.Survived==1)]['Rank'].count()
c_u=train_F.loc[(train_F.Rank=='C')&(train_F.Survived==0)]['Rank'].count()

d_s=train_F.loc[(train_F.Rank=="D")&(train_F.Survived==1)]['Rank'].count()
d_u=train_F.loc[(train_F.Rank=='D')&(train_F.Survived==0)]['Rank'].count()

e_s=train_F.loc[(train_F.Rank=="E")&(train_F.Survived==1)]['Rank'].count()
e_u=train_F.loc[(train_F.Rank=='E')&(train_F.Survived==0)]['Rank'].count()

x1=[a_s,b_s,c_s,d_s,e_s]
x2=[a_u,b_u,c_u,d_u,e_u]

i=np.arange(5)
plt.bar(i,x1,color='g',label='Survived')
plt.bar(i,x2,color='r',bottom=x1,label='Unsurvived')
plt.xticks(i,['0-100','101-200','201-300','301-400','401-550'],rotation=60)
plt.xlabel('Region of Fare')
plt.ylabel('Number of Fare')
plt.legend(loc='upper right')
plt.show()
Cabin特征分析
c_s=train.loc[(train.Cabin.isnull())&(train.Survived==1)]['Survived'].count()
c_u=train.loc[(train.Cabin.isnull())&(train.Survived==0)]['Survived'].count()

nc_s=train.loc[(train.Cabin.notnull())&(train.Survived==1)]['Survived'].count()
nc_u=train.loc[(train.Cabin.notnull())&(train.Survived==0)]['Survived'].count()

p1=[c_s,c_u]
p2=[nc_s,nc_u]

plt.figure(figsize=(6,2))
colors=['green','red']

plt.subplot(121)
plt.pie(p1,explode=[0.04,0.04],shadow=True,colors=colors,labels=['Survived','Unsurvived'],autopct='%1.1f%%')
plt.title('Non Cabin Record')
plt.subplot(122)
plt.pie(p2,explode=[0.04,0.04],shadow=True,colors=colors,labels=['Survived','Unsurvived'],autopct='%1.1f%%')
plt.title('Cabin Record')
plt.show()
Embarked特征分析
train.Embarked.unique()

es_s=train.loc[(train.Embarked=='S')&(train.Survived==1)]['Survived'].count()
es_u=train.loc[(train.Embarked=='S')&(train.Survived==0)]['Survived'].count()

ec_s=train.loc[(train.Embarked=='C')&(train.Survived==1)]['Survived'].count()
ec_u=train.loc[(train.Embarked=='C')&(train.Survived==0)]['Survived'].count()

eq_s=train.loc[(train.Embarked=='Q')&(train.Survived==1)]['Survived'].count()
eq_u=train.loc[(train.Embarked=='Q')&(train.Survived==0)]['Survived'].count()

enon_s=train.loc[(train.Embarked.isnull())&(train.Survived==1)]['Survived'].count()
enon_u=train.loc[(train.Embarked.isnull())&(train.Survived==0)]['Survived'].count()

p9=[es_s,es_u]
p8=[ec_s,ec_u]
p7=[eq_s,eq_u]
p6=[enon_s,enon_u]

plt.figure(figsize=(10,2))
colors=['green','red']
explode=[0.04,0.04]
autopct='%1.1f%%'
label=['Survived','Unsurvived']

plt.subplot(141)
plt.pie(p9,colors=colors,autopct=autopct,explode=explode,labels=label)
plt.title('Embark_S')

plt.subplot(142)
plt.pie(p8,colors=colors,autopct=autopct,explode=explode,labels=label)
plt.title('Embark_C')

plt.subplot(143)
plt.pie(p7,colors=colors,autopct=autopct,explode=explode,labels=label)
plt.title('Embark_Q')

plt.subplot(144)
plt.pie(p6,colors=colors,autopct=autopct,explode=explode,labels=label)
plt.title('Embark_NON')

plt.show()
利用决策树算法对存活率预测
首先将无用的特征删除
train_c=train.drop(['Name','Ticket','Cabin','Rank','PassengerId'],axis=1) #删除无用的特征Name,Ticket,cabin

#将男性女性换为1,0
train_c['Sex'].replace(['male','female'],[1,0],inplace=True)
train_c['Sex']=train_c['Sex'].astype(int)
"""另一种替换方法
train.loc[(train.Sex)=='male','Sex']=1
train.loc[(train.Sex)=='female','Sex']=0
"""
#将登船港口数据转为数值类型
embarked_unique=train_c['Embarked'].unique().tolist()  #将港口类型不重复地提取出来,并转为列表形式
train_c['Embarked']=train_c['Embarked'].apply(lambda x:embarked_unique.index(x))  #把港口换为0,1,2,3,也可以用前面的方法

train_d=train_c.dropna()  #删除有缺失值的行
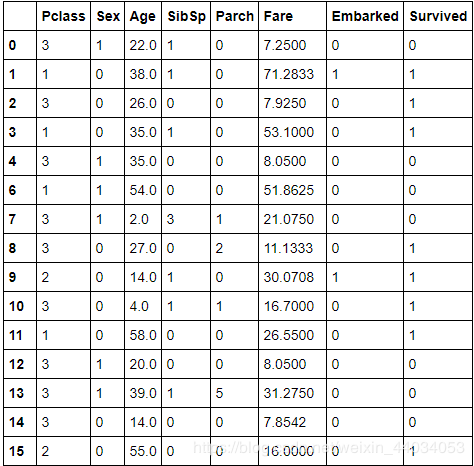
此时得到的数据全为数值形式
然后利用sklearn中的交叉验证法划分数据集
from sklearn.cross_validation import train_test_split
x_train,x_test,y_train,y_test=train_test_split(x,y,test_size=0.3)

from sklearn.tree import DecisionTreeClassifier
clf=DecisionTreeClassifier()
clf.fit(x_train,y_train)

clf.score(x_test,y_test)

from sklearn.metrics import classification_report
y_pre=clf.predict(x_test)
print(classification_report(y_pre,y_test,target_names=['Unsurvived','Survived']))


