Kaggle实战——泰坦尼克生存预测大赛


In [6]:
import csv
import numpy as np
csv_file_object = csv.reader(open('D:/In/kaggle/Titanic/train.csv', 'rt'))

data=[] 
for row in csv_file_object:
    data.append(row)
#data = np.array(data)
print (data[0])
print (np.array(data)[0])
['PassengerId', 'Survived', 'Pclass', 'Name', 'Sex', 'Age', 'SibSp', 'Parch', 'Ticket', 'Fare', 'Cabin', 'Embarked']
['PassengerId' 'Survived' 'Pclass' 'Name' 'Sex' 'Age' 'SibSp' 'Parch'
 'Ticket' 'Fare' 'Cabin' 'Embarked']
In [ ]:
'''
#数据处理
import numpy as np
import pandas as pd
#绘图
import seaborn as sns
import matplotlib.pyplot as plt
%matplotlib inline
#各种模型、数据处理方法
from sklearn.preprocessing import LabelEncoder
from sklearn.model_selection import train_test_split
from sklearn.linear_model import LogisticRegression
from sklearn.svm import SVC, LinearSVC
from sklearn.ensemble import RandomForestClassifier
from sklearn.neighbors import KNeighborsClassifier
from sklearn.naive_bayes import GaussianNB
from sklearn.linear_model import Perceptron
from sklearn.linear_model import SGDClassifier
from sklearn.tree import DecisionTreeClassifier
from xgboost import XGBClassifier
from sklearn.metrics import precision_score
from sklearn.ensemble import GradientBoostingClassifier
from sklearn.model_selection import GridSearchCV, cross_val_score, StratifiedKFold, learning_curve
import warnings
warnings.filterwarnings('ignore')
'''
In [2]:
print (data[:3])    #list是一维的,array是二维的
print (np.array(data)[:3])
print (np.array(data)[:15,5])
#print (data[0:15,5])
data=np.array(data)
type(data)         #data此时为一个二维的数组
[['PassengerId', 'Survived', 'Pclass', 'Name', 'Sex', 'Age', 'SibSp', 'Parch', 'Ticket', 'Fare', 'Cabin', 'Embarked'], ['1', '0', '3', 'Braund, Mr. Owen Harris', 'male', '22', '1', '0', 'A/5 21171', '7.25', '', 'S'], ['2', '1', '1', 'Cumings, Mrs. John Bradley (Florence Briggs Thayer)', 'female', '38', '1', '0', 'PC 17599', '71.2833', 'C85', 'C']]
[['PassengerId' 'Survived' 'Pclass' 'Name' 'Sex' 'Age' 'SibSp' 'Parch'
  'Ticket' 'Fare' 'Cabin' 'Embarked']
 ['1' '0' '3' 'Braund, Mr. Owen Harris' 'male' '22' '1' '0' 'A/5 21171'
  '7.25' '' 'S']
 ['2' '1' '1' 'Cumings, Mrs. John Bradley (Florence Briggs Thayer)'
  'female' '38' '1' '0' 'PC 17599' '71.2833' 'C85' 'C']]
['Age' '22' '38' '26' '35' '35' '' '54' '2' '27' '14' '4' '58' '20' '39']
Out[2]:
numpy.ndarray
In [3]:
print(data[1:6,5])
print(data[1:6,5].astype(int))
print(data[1:6,5].astype(int).mean())
['22' '38' '26' '35' '35']
[22 38 26 35 35]
31.2
In [1]:
import pandas as pd
%matplotlib inline
df=pd.read_csv('D:/In/kaggle/Titanic/train.csv')
df_test=pd.read_csv('D:/In/kaggle/Titanic/test.csv')
print(df.info())
print(df[['Age','Sex','Pclass']][:10])
print(df[df['Age']>60][['Survived','Pclass','Sex','Age']])
df[df['Age'].isnull()][:10]   #只显示年龄为空的数据

RangeIndex: 891 entries, 0 to 890
Data columns (total 12 columns):
PassengerId    891 non-null int64
Survived       891 non-null int64
Pclass         891 non-null int64
Name           891 non-null object
Sex            891 non-null object
Age            714 non-null float64
SibSp          891 non-null int64
Parch          891 non-null int64
Ticket         891 non-null object
Fare           891 non-null float64
Cabin          204 non-null object
Embarked       889 non-null object
dtypes: float64(2), int64(5), object(5)
memory usage: 83.6+ KB
None
    Age     Sex  Pclass
0  22.0    male       3
1  38.0  female       1
2  26.0  female       3
3  35.0  female       1
4  35.0    male       3
5   NaN    male       3
6  54.0    male       1
7   2.0    male       3
8  27.0  female       3
9  14.0  female       2
     Survived  Pclass     Sex   Age
33          0       2    male  66.0
54          0       1    male  65.0
96          0       1    male  71.0
116         0       3    male  70.5
170         0       1    male  61.0
252         0       1    male  62.0
275         1       1  female  63.0
280         0       3    male  65.0
326         0       3    male  61.0
438         0       1    male  64.0
456         0       1    male  65.0
483         1       3  female  63.0
493         0       1    male  71.0
545         0       1    male  64.0
555         0       1    male  62.0
570         1       2    male  62.0
625         0       1    male  61.0
630         1       1    male  80.0
672         0       2    male  70.0
745         0       1    male  70.0
829         1       1  female  62.0
851         0       3    male  74.0
Out[1]:
  PassengerId Survived Pclass Name Sex Age SibSp Parch Ticket Fare Cabin Embarked
5 6 0 3 Moran, Mr. James male NaN 0 0 330877 8.4583 NaN Q
17 18 1 2 Williams, Mr. Charles Eugene male NaN 0 0 244373 13.0000 NaN S
19 20 1 3 Masselmani, Mrs. Fatima female NaN 0 0 2649 7.2250 NaN C
26 27 0 3 Emir, Mr. Farred Chehab male NaN 0 0 2631 7.2250 NaN C
28 29 1 3 O'Dwyer, Miss. Ellen "Nellie" female NaN 0 0 330959 7.8792 NaN Q
29 30 0 3 Todoroff, Mr. Lalio male NaN 0 0 349216 7.8958 NaN S
31 32 1 1 Spencer, Mrs. William Augustus (Marie Eugenie) female NaN 1 0 PC 17569 146.5208 B78 C
32 33 1 3 Glynn, Miss. Mary Agatha female NaN 0 0 335677 7.7500 NaN Q
36 37 1 3 Mamee, Mr. Hanna male NaN 0 0 2677 7.2292 NaN C
42 43 0 3 Kraeff, Mr. Theodor male NaN 0 0 349253 7.8958 NaN C
In [2]:
import seaborn as sns
import matplotlib.pyplot as plt
sns.set(context="paper", font="monospace")
sns.set(style="white")
f, ax = plt.subplots(figsize=(10,6))
train_corr = df.drop('PassengerId',axis=1).corr()
sns.heatmap(train_corr, ax=ax, vmax=.9, square=True)
ax.set_xticklabels(train_corr.index, size=15)
ax.set_yticklabels(train_corr.columns[::1], size=15)
ax.set_title('train feature corr', fontsize=20)
Out[2]:
Kaggle实战——泰坦尼克生存预测大赛_第1张图片
In [5]:
for i in range(1,4):
    print (i, len (df[ (df['Sex']=='male')&(df['Pclass'] == i) ]) )   #输出不同等级仓中男士的数量
1 122
2 108
3 347
In [6]:
import pylab as p
df['Age'].dropna().hist(range=(0,100),bins=19,alpha=0.8),p.show()   #bins代表直方柱的个数 alpha控制颜色深浅
  Kaggle实战——泰坦尼克生存预测大赛_第2张图片
Out[6]:
(, None)
In [7]:
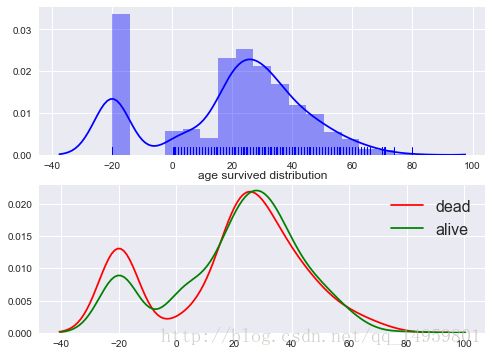
from scipy import stats
fig,axes=plt.subplots(2,1,figsize=(8,6))
sns.set_style('darkgrid')#设置风格主题
sns.distplot(df.Age.fillna(-20),rug=True,color='b',ax=axes[0])#rug强度(齿)
ax0=axes[0]
ax0.set_xlabel('')

ax1=axes[1]
ax1.set_title('age survived distribution')
k1=sns.distplot(df[df.Survived==0].Age.fillna(-20),hist=False,color='r',ax=ax1,label='dead')#罹难的年龄分布
k2=sns.distplot(df[df.Survived==1].Age.fillna(-20),hist=False,color='g',ax=ax1,label='alive')#存活的年龄分布
ax1.set_xlabel('')#x坐标轴名字

ax1.legend(fontsize=16)#小朋友和中青年比较容易存活
Out[7]:
  Kaggle实战——泰坦尼克生存预测大赛_第3张图片
In [8]:
f,ax=plt.subplots(figsize=(8,3))
ax.set_title('Sex Age dist',size=20)
sns.distplot(df[df.Sex=='female'].dropna().Age,hist=False,color='pink',label='female')
sns.distplot(df[df.Sex=='male'].dropna().Age,hist=False,color='blue',label='male')
ax.legend(fontsize=15)#训练集中的男女年龄分布 男性中老年较多 女性较年轻
Out[8]:
  Kaggle实战——泰坦尼克生存预测大赛_第4张图片
In [16]:
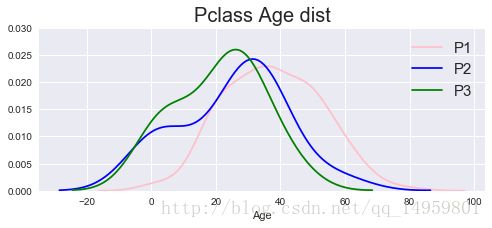
f,ax=plt.subplots(figsize=(8,3))
plt.ylim(0.0,0.03)
ax.set_title('Pclass Age dist',size=20)
sns.distplot(df[df.Pclass==1].dropna().Age,hist=False,color='pink',label='P1')
sns.distplot(df[df.Pclass==2].dropna().Age,hist=False,color='blue',label='P2')
sns.distplot(df[df.Pclass==3].dropna().Age,hist=False,color='green',label='P3')
ax.legend(fontsize=15)#不同仓级年龄分布
Out[16]:
  Kaggle实战——泰坦尼克生存预测大赛_第5张图片
In [35]:
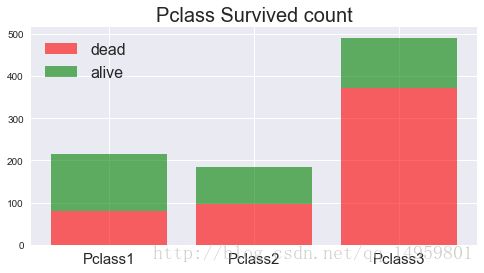
y_dead=df[df.Survived==0].groupby('Pclass')['Survived'].count()
y_alive=df[df.Survived==1].groupby('Pclass')['Survived'].count()
pos=[1,2,3]#横轴id
ax=plt.figure(figsize=(8,4)).add_subplot(111)
ax.bar(pos,y_dead,color='r',alpha=0.6,label='dead')
ax.bar(pos,y_alive,color='g',bottom=y_dead,alpha=0.6,label='alive')
ax.legend(fontsize=16,loc='best')
ax.set_xticks(pos)
ax.set_xticklabels(['Pclass%d'%(i) for i in range(1,4)],size=15)#x坐标轴信息
ax.set_title('Pclass Survived count',size=20)#不同仓级存活情况
Out[35]:
  Kaggle实战——泰坦尼克生存预测大赛_第6张图片
In [29]:
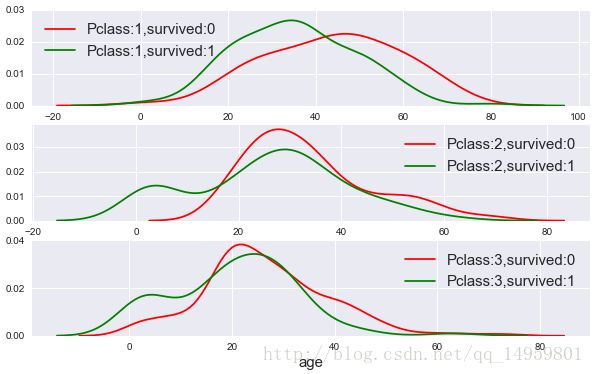
pos=range(0,6)
age_list=[]
for Pclass_ in range(1,4):
    for Survived_ in range(0,2):
        age_list.append(df[(df.Pclass==Pclass_)&(df.Survived==Survived_)].Age.values)
#三个仓级的存亡年龄        
fig,axes=plt.subplots(3,1,figsize=(10,6))
sns.set_style('darkgrid')#设置风格主题
#plt.ylim(0.0,0.06)
#print(axes)
print(len(age_list))
i_Pclass=1
for ax in axes:
    if i_Pclass==1:
        ax.set_ylim(0.0, 0.03)#设置y轴范围
    sns.distplot(age_list[i_Pclass*2-2],hist=False,ax=ax,label='Pclass:%d,survived:0'%(i_Pclass),color='r')
    sns.distplot(age_list[i_Pclass*2-1],hist=False,ax=ax,label='Pclass:%d,survived:1'%(i_Pclass),color='g')
    i_Pclass+=1
    ax.set_xlabel('age',size=15)
    ax.legend(fontsize=15)
6
D:\Anaconda3\lib\site-packages\statsmodels\nonparametric\kde.py:454: RuntimeWarning: invalid value encountered in greater
  X = X[np.logical_and(X>clip[0], Xclip[0], X 
        
Kaggle实战——泰坦尼克生存预测大赛_第7张图片
In [33]:
#性别
print(df.Sex.value_counts())
print('******************************')
print(df.groupby('Sex')['Survived'].mean())#男女存活率
male      577
female    314
Name: Sex, dtype: int64
******************************
Sex
female    0.742038
male      0.188908
Name: Survived, dtype: float64
In [36]:
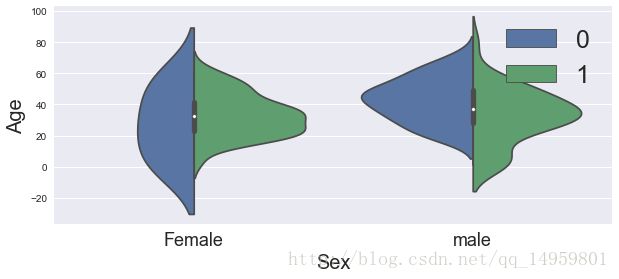
ax=plt.figure(figsize=(10,4)).add_subplot(111)
sns.violinplot(x='Sex',y='Age',hue='Survived',data=df.dropna(),split=True)#小提琴图
ax.set_xlabel('Sex',size=20)
ax.set_xticklabels(['Female','male'],size=18)
ax.set_ylabel('Age',size=20)
ax.legend(fontsize=25,loc='best')#男女存亡年龄分布
Out[36]:
  Kaggle实战——泰坦尼克生存预测大赛_第8张图片
In [42]:
label=[]
for sex_i in ['female','male']:
    for pclass_i in range(1,4):
        label.append('sex:%s,Pclass:%d'%(sex_i,pclass_i))
        
pos=range(6)
fig=plt.figure(figsize=(16,4))
ax=fig.add_subplot(111)
ax.bar(pos,df[df['Survived']==0].groupby(['Sex','Pclass'])['Survived'].count().values,
      color='r',
      alpha=0.5,
      align='center',
      tick_label=label,
      label='dead')
ax.bar(pos,
      df[df['Survived']==1].groupby(['Sex','Pclass'])['Survived'].count().values,
      bottom=df[df['Survived']==0].groupby(['Sex','Pclass'])['Survived'].count().values,
      color='g',
      alpha=0.5,
      align='center',
      tick_label=label,
      label='alive')
ax.tick_params(labelsize=15)
ax.set_title('sex_pclass_survived',size=30)
ax.legend(fontsize=15,loc='best')#相同性别情况下,仓级越高越容易存活
Out[42]:
  Kaggle实战——泰坦尼克生存预测大赛_第9张图片
In [69]:
#Fare费用
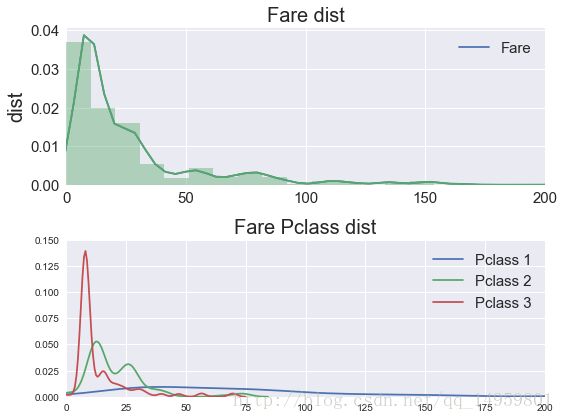
fig=plt.figure(figsize=(8,6))
ax=plt.subplot2grid((2,2),(0,0),colspan=2)#角标
#fig,ax=plt.subplots(1,1,figsize=(8,6))
ax.tick_params(labelsize=15)
ax.set_title('Fare dist',size=20)
ax.set_ylabel('dist',size=20)
sns.kdeplot(df.Fare,ax=ax)
sns.distplot(df.Fare,hist=True,ax=ax)
ax.legend(fontsize=15)
pos=range(0,400,50)
ax.set_xticks(pos)
ax.set_xlim([0,200])
ax.set_xlabel('')

#fig,ax1=plt.subplots(1,1,figsize=(8,6))
ax1=plt.subplot2grid((2,2),(1,0),colspan=2)
ax1.set_title('Fare Pclass dist',size=20)
for i in range(1,4):
    sns.kdeplot(df[df.Pclass==i].Fare,ax=ax1,label='Pclass %d'%(i))#不同仓级的票价分布
ax1.set_xlim([0,200])
ax1.set_ylim([0,0.15])
ax1.legend(fontsize=15)#船票价分布
plt.tight_layout()#间距松紧
  Kaggle实战——泰坦尼克生存预测大赛_第10张图片
In [70]:
fig=plt.figure(figsize=(8,3))
ax1=fig.add_subplot(111)
sns.kdeplot(df[df.Survived==0].Fare,ax=ax1,label='dead',color='r')
sns.kdeplot(df[df.Survived==1].Fare,ax=ax1,label='alive',color='g')
#sns.distplot(df[df.Survived==0].Fare,ax=ax1,color='r')
#sns.distplot(df[df.Survived==1].Fare,ax=ax1,color='g')
ax1.set_xlim([0,300])
ax1.legend(fontsize=15)
ax1.set_title('Fare survived',size=20)
ax1.set_xlabel('Fare',size=15)#存亡票价分布
Out[70]:
  Kaggle实战——泰坦尼克生存预测大赛_第11张图片
In [73]:
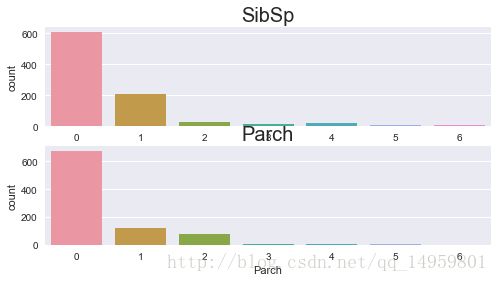
fig=plt.figure(figsize=(8,4))
ax1=fig.add_subplot(211)
sns.countplot(df.SibSp)#计数
ax1.set_title('SibSp',size=20)
ax2=fig.add_subplot(212,sharex=ax1)
sns.countplot(df.Parch)
ax2.set_title('Parch',size=20)#表亲和直亲
#plt.tight_layout()
Out[73]:
  Kaggle实战——泰坦尼克生存预测大赛_第12张图片
In [76]:
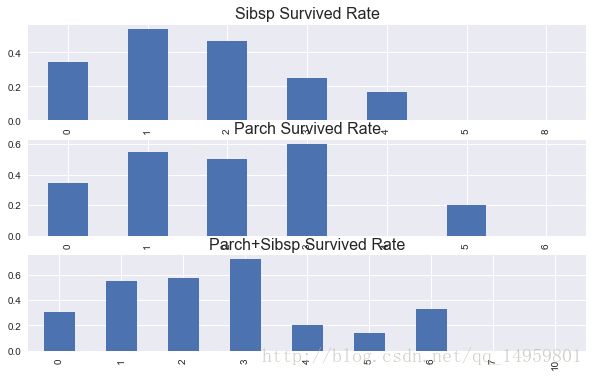
fig=plt.figure(figsize=(10,6))
ax1=fig.add_subplot(311)
df.groupby('SibSp')['Survived'].mean().plot(kind='bar',ax=ax1)#存活率
ax1.set_title('Sibsp Survived Rate',size=16)
ax1.set_xlabel('')

ax2=fig.add_subplot(312)
df.groupby('Parch')['Survived'].mean().plot(kind='bar',ax=ax2)
ax2.set_title('Parch Survived Rate',size=16)
ax2.set_xlabel('')

ax3=fig.add_subplot(313)
df.groupby(df.SibSp+df.Parch)['Survived'].mean().plot(kind='bar',ax=ax3)
ax3.set_title('Parch+Sibsp Survived Rate',size=16)
#plt.tight_layout()
Out[76]:
  Kaggle实战——泰坦尼克生存预测大赛_第13张图片
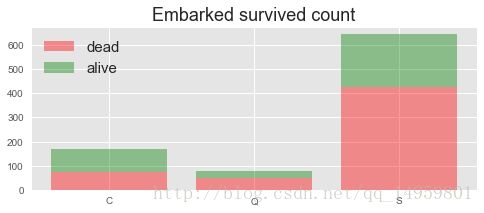
In [85]:
#上船地点
plt.style.use('ggplot')#美化
ax=plt.figure(figsize=(8,3)).add_subplot(111)
pos=[1,2,3]
y1=df[df.Survived==0].groupby('Embarked')['Survived'].count().sort_index().values#确保存亡的一一对应
print(y1)
y2=df[df.Survived==1].groupby('Embarked')['Survived'].count().sort_index().values
ax.bar(pos,y1,color='r',alpha=0.4,align='center',label='dead')
ax.bar(pos,y2,color='g',alpha=0.4,align='center',label='alive',bottom=y1)
ax.set_xticks(pos)
ax.set_xticklabels(['C','Q','S'])
ax.legend(fontsize=15,loc='best')
ax.set_title('Embarked survived count',size=18)
[ 75  47 427]
Out[85]:
  Kaggle实战——泰坦尼克生存预测大赛_第14张图片
In [94]:
#C地存活概率较高
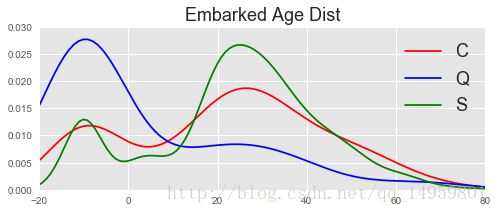
#不同的上船地点
ax=plt.figure(figsize=(8,3)).add_subplot(111)
ax.set_xlim([-20,80])
ax.set_ylim([0.0,0.03])
sns.kdeplot(df[df.Embarked=='C'].Age.fillna(-10),ax=ax,label='C',color='r')
sns.kdeplot(df[df.Embarked=='Q'].Age.fillna(-10),ax=ax,label='Q',color='b')
sns.kdeplot(df[df.Embarked=='S'].Age.fillna(-10),ax=ax,label='S',color='g')
ax.legend(fontsize=18)
ax.set_title('Embarked Age Dist',size=18)
#plt.tight_layout()
#Q上岸的年龄缺失比较多
#C和S上岸的年龄分布较相似,但是C的分布更扁平小孩和老人的占比更高
Out[94]:
  Kaggle实战——泰坦尼克生存预测大赛_第15张图片
In [103]:
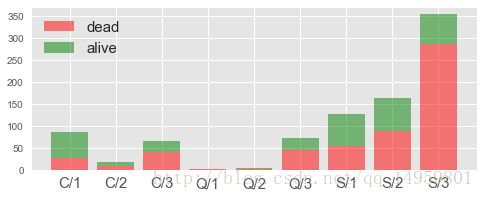
#不同仓位不同地点
y1=df[df.Survived==0].groupby(['Embarked','Pclass'])['Survived'].count().reset_index()['Survived'].values
print(y1)
y2=df[df.Survived==1].groupby(['Embarked','Pclass'])['Survived'].count().reset_index()['Survived'].values

ax=plt.figure(figsize=(8,3)).add_subplot(111)
pos=range(9)
ax.bar(pos,y1,align='center',alpha=0.5,color='r',label='dead')
ax.bar(pos,y2,align='center',bottom=y1,alpha=0.5,color='g',label='alive')

ax.set_xticks(pos)
xticklabels=[]
for embarked_val in ['C','Q','S']:
    for pclass_val in range(1,4):
        xticklabels.append('%s/%d'%(embarked_val,pclass_val))
        
ax.set_xticklabels(xticklabels,size=15)
ax.legend(fontsize=15,loc='best')#C地的存活率似乎更高
[ 26   8  41   1   1  45  53  88 286]
Out[103]:
  Kaggle实战——泰坦尼克生存预测大赛_第16张图片
In [123]:
#Cabin船舱号
print(df['Cabin'].isnull().value_counts())
df.groupby(df['Cabin'].isnull())['Survived'].mean()
#船舱号为空的存活率低,可以作为一个特征
True     687
False    204
Name: Cabin, dtype: int64
Out[123]:
Cabin
False    0.666667
True     0.299854
Name: Survived, dtype: float64
In [148]:
print(df[df['PassengerId']==28]['Cabin'])
print(len(df.loc[27,'Cabin']))
df[df.Cabin.apply(lambda x:len(x) if (x is not np.nan) else 0)>4].head(10)#返回Cabin大于4个字符的(有多个船舱的)
27    C23 C25 C27
Name: Cabin, dtype: object
11
Out[148]:
  PassengerId Survived Pclass Name Sex Age SibSp Parch Ticket Fare Cabin Embarked
27 28 0 1 Fortune, Mr. Charles Alexander male 19.00 3 2 19950 263.0000 C23 C25 C27 S
75 76 0 3 Moen, Mr. Sigurd Hansen male 25.00 0 0 348123 7.6500 F G73 S
88 89 1 1 Fortune, Miss. Mabel Helen female 23.00 3 2 19950 263.0000 C23 C25 C27 S
97 98 1 1 Greenfield, Mr. William Bertram male 23.00 0 1 PC 17759 63.3583 D10 D12 C
118 119 0 1 Baxter, Mr. Quigg Edmond male 24.00 0 1 PC 17558 247.5208 B58 B60 C
128 129 1 3 Peter, Miss. Anna female NaN 1 1 2668 22.3583 F E69 C
297 298 0 1 Allison, Miss. Helen Loraine female 2.00 1 2 113781 151.5500 C22 C26 S
299 300 1 1 Baxter, Mrs. James (Helene DeLaudeniere Chaput) female 50.00 0 1 PC 17558 247.5208 B58 B60 C
305 306 1 1 Allison, Master. Hudson Trevor male 0.92 1 2 113781 151.5500 C22 C26 S
311 312 1 1 Ryerson, Miss. Emily Borie female 18.00 2 2 PC 17608 262.3750 B57 B59 B63 B66 C
In [149]:
#不同船舱的存亡统计
df['Cabin_Zone']=df.Cabin.fillna('0').str.split(' ').apply(lambda x: x[0][0])
df.groupby(by='Cabin_Zone')['Survived'].agg(['mean','count'])
#不同船舱的存亡率不一样
Out[149]:
  mean count
Cabin_Zone    
0 0.299854 687
A 0.466667 15
B 0.744681 47
C 0.593220 59
D 0.757576 33
E 0.750000 32
F 0.615385 13
G 0.500000 4
T 0.000000 1
In [155]:
#船票Ticket
print(df.Ticket.head())
print(len(df.Ticket.unique()))#船票有重复的
df[df.Ticket=='110152']
0           A/5 21171
1            PC 17599
2    STON/O2. 3101282
3              113803
4              373450
Name: Ticket, dtype: object
681
Out[155]:
  PassengerId Survived Pclass Name Sex Age SibSp Parch Ticket Fare Cabin Embarked Cabin_Zone
257 258 1 1 Cherry, Miss. Gladys female 30.0 0 0 110152 86.5 B77 S B
504 505 1 1 Maioni, Miss. Roberta female 16.0 0 0 110152 86.5 B79 S B
759 760 1 1 Rothes, the Countess. of (Lucy Noel Martha Dye... female 33.0 0 0 110152 86.5 B77 S B
In [165]:
#船票有重复的
print(df[df.Cabin=='B77'])

#有些船票有英文,有些则没有,使用正则!!!!!!
import re
def find_e_word(x):
    pattern=re.compile('[a-z]|[A-Z]')
    try:
        re.search(pattern,x).group()
        return 1
    except:
        return 0
    
df['Ticket_e']=df.Ticket.apply(lambda x: find_e_word(x))
df.groupby('Ticket_e')['Survived'].mean()
#存活率没区别
     PassengerId  Survived  Pclass  \
257          258         1       1   
759          760         1       1   

                                                  Name     Sex   Age  SibSp  \
257                               Cherry, Miss. Gladys  female  30.0      0   
759  Rothes, the Countess. of (Lucy Noel Martha Dye...  female  33.0      0   

     Parch  Ticket  Fare Cabin Embarked Cabin_Zone  Ticket_e  
257      0  110152  86.5   B77        S          B         0  
759      0  110152  86.5   B77        S          B         0  
Out[165]:
Ticket_e
0    0.384266
1    0.382609
Name: Survived, dtype: float64
In [174]:
#名字Name
print(df.Name.apply(lambda x: x.split(',')[1].split('.')[0]).value_counts())
df.Name.apply(lambda x: x.split(',')[1].split('.')[1]).value_counts()[:8]
 Mr              517
 Miss            182
 Mrs             125
 Master           40
 Dr                7
 Rev               6
 Major             2
 Col               2
 Mlle              2
 Capt              1
 the Countess      1
 Don               1
 Ms                1
 Lady              1
 Mme               1
 Jonkheer          1
 Sir               1
Name: Name, dtype: int64
Out[174]:
 John             9
 James            7
 Mary             6
 William          6
 Ivan             4
 Bertha           4
 William Henry    4
 William John     4
Name: Name, dtype: int64
In [ ]:
#--------------------------------
In [183]:
df.head()
Out[183]:
  PassengerId Survived Pclass Name Sex Age SibSp Parch Ticket Fare Cabin Embarked Cabin_Zone Ticket_e
0 1 0 3 Braund, Mr. Owen Harris male 22.0 1 0 A/5 21171 7.2500 NaN S 0 1
1 2 1 1 Cumings, Mrs. John Bradley (Florence Briggs Th... female 38.0 1 0 PC 17599 71.2833 C85 C C 1
2 3 1 3 Heikkinen, Miss. Laina female 26.0 0 0 STON/O2. 3101282 7.9250 NaN S 0 1
3 4 1 1 Futrelle, Mrs. Jacques Heath (Lily May Peel) female 35.0 1 0 113803 53.1000 C123 S C 0
4 5 0 3 Allen, Mr. William Henry male 35.0 0 0 373450 8.0500 NaN S 0 0
In [177]:
#查看数据缺失情况
print(df.isnull().sum())
df_test.isnull().sum()
PassengerId      0
Survived         0
Pclass           0
Name             0
Sex              0
Age            177
SibSp            0
Parch            0
Ticket           0
Fare             0
Cabin          687
Embarked         2
Cabin_Zone       0
Ticket_e         0
dtype: int64
Out[177]:
PassengerId      0
Pclass           0
Name             0
Sex              0
Age             86
SibSp            0
Parch            0
Ticket           0
Fare             1
Cabin          327
Embarked         0
dtype: int64
In [179]:
df[df['Embarked'].isnull()]
Out[179]:
  PassengerId Survived Pclass Name Sex Age SibSp Parch Ticket Fare Cabin Embarked Cabin_Zone Ticket_e
61 62 1 1 Icard, Miss. Amelie female 38.0 0 0 113572 80.0 B28 NaN B 0
829 830 1 1 Stone, Mrs. George Nelson (Martha Evelyn) female 62.0 0 0 113572 80.0 B28 NaN B 0
In [181]:
print(df['Embarked'].value_counts())
print(df[df['Pclass']==1].Embarked.value_counts())
df.Embarked.fillna('S',inplace=True)
#上船地点填充
S    644
C    168
Q     77
Name: Embarked, dtype: int64
Out[181]:
S    127
C     85
Q      2
Name: Embarked, dtype: int64
In [234]:
#Cabin缺失值的处理,方法一
df['Cabin_e']=df['Cabin'].isnull().map({True:0,False:1})
df_test['Cabin_e']=df_test['Cabin'].isnull().map({True:0,False:1})
#df=df.drop(['Cabin_e'],axis=1)


#df['Cabin_e']=df['Cabin'].isnull().map(lambda x:0 if x is True else 1)方法二!!!!!!
#df_test['Cabin_e']
#df.head()
#df=df.drop(['Cabin_e'],axis=1)

"""方法三
import re
def Cabin_isnull(x):
    pattern=re.compile("\d$")
    try:
        re.search(pattern,x).group()
        return 1
    except:
        return 0
df['Cabin_e']=df['Cabin'].apply(lambda x: Cabin_isnull(x))
df.head()
"""
df_test.head()
Out[234]:
  PassengerId Pclass Name Sex Age SibSp Parch Ticket Fare Cabin Embarked Cabin_e
0 892 3 Kelly, Mr. James male 34.5 0 0 330911 7.8292 NaN Q 0
1 893 3 Wilkes, Mrs. James (Ellen Needs) female 47.0 1 0 363272 7.0000 NaN S 0
2 894 2 Myles, Mr. Thomas Francis male 62.0 0 0 240276 9.6875 NaN Q 0
3 895 3 Wirz, Mr. Albert male 27.0 0 0 315154 8.6625 NaN S 0
4 896 3 Hirvonen, Mrs. Alexander (Helga E Lindqvist) female 22.0 1 1 3101298 12.2875 NaN S 0
In [8]:
df['Gender']=5
df['Gender']=df['Sex'].map(lambda x:x[0].upper())
print(df.head())
df['Gender']=df['Sex'].map({'male':1,'female':0})    #并行化执行
df.head()
   PassengerId  Survived  Pclass  \
0            1         0       3   
1            2         1       1   
2            3         1       3   
3            4         1       1   
4            5         0       3   

                                                Name     Sex   Age  SibSp  \
0                            Braund, Mr. Owen Harris    male  22.0      1   
1  Cumings, Mrs. John Bradley (Florence Briggs Th...  female  38.0      1   
2                             Heikkinen, Miss. Laina  female  26.0      0   
3       Futrelle, Mrs. Jacques Heath (Lily May Peel)  female  35.0      1   
4                           Allen, Mr. William Henry    male  35.0      0   

   Parch            Ticket     Fare Cabin Embarked Gender  
0      0         A/5 21171   7.2500   NaN        S      M  
1      0          PC 17599  71.2833   C85        C      F  
2      0  STON/O2. 3101282   7.9250   NaN        S      F  
3      0            113803  53.1000  C123        S      F  
4      0            373450   8.0500   NaN        S      M  
Out[8]:
  PassengerId Survived Pclass Name Sex Age SibSp Parch Ticket Fare Cabin Embarked Gender
0 1 0 3 Braund, Mr. Owen Harris male 22.0 1 0 A/5 21171 7.2500 NaN S 1
1 2 1 1 Cumings, Mrs. John Bradley (Florence Briggs Th... female 38.0 1 0 PC 17599 71.2833 C85 C 0
2 3 1 3 Heikkinen, Miss. Laina female 26.0 0 0 STON/O2. 3101282 7.9250 NaN S 0
3 4 1 1 Futrelle, Mrs. Jacques Heath (Lily May Peel) female 35.0 1 0 113803 53.1000 C123 S 0
4 5 0 3 Allen, Mr. William Henry male 35.0 0 0 373450 8.0500 NaN S 1
In [236]:
#Age年龄离散化,以5岁为一个周期
def age_map(x):
    if x<10:
        return '10-'
    if x<60:
        return '%d-%d'%(x//5*5,x//5*5+5)
    elif x>=60:
        return '60+'
    else:
        return 'Null'
df['Age_map']=df['Age'].apply(lambda x: age_map(x))
df_test['Age_map']=df_test['Age'].apply(lambda x:age_map(x))
df.groupby('Age_map')['Survived'].agg(['count','mean'])#不同年龄层的存亡情况
Out[236]:
  count mean
Age_map    
10- 62 0.612903
10-15 16 0.437500
15-20 86 0.395349
20-25 114 0.342105
25-30 106 0.358491
30-35 95 0.421053
35-40 72 0.458333
40-45 48 0.375000
45-50 41 0.390244
50-55 32 0.437500
55-60 16 0.375000
60+ 26 0.269231
Null 177 0.293785
In [247]:
#test中的Fare缺失
print(df_test[df_test['Fare'].isnull()])
df_test.loc[df_test.Fare.isnull(),'Fare']=df_test[(df_test['Pclass']==3)&(df_test['Embarked']=='S')&(df_test['Sex']=='male')].dropna().Fare.mean()
df_test[df_test['PassengerId']==1044]
Empty DataFrame
Columns: [PassengerId, Pclass, Name, Sex, Age, SibSp, Parch, Ticket, Fare, Cabin, Embarked, Cabin_e, Age_map]
Index: []
Out[247]:
  PassengerId Pclass Name Sex Age SibSp Parch Ticket Fare Cabin Embarked Cabin_e Age_map
152 1044 3 Storey, Mr. Thomas male 60.5 0 0 3701 7.65 NaN S 0 60+
In [266]:
#数据归一化以加速模型收敛,Fare分布太宽
import sklearn.preprocessing as preprocessing
scaler=preprocessing.StandardScaler()
fare_scale_param=scaler.fit(df['Fare'].values.reshape(-1,1))

df['Fare_e']=fare_scale_param.transform(df['Fare'].values.reshape(-1,1))
df_test['Fare_e']=fare_scale_param.transform(df_test['Fare'].values.reshape(-1,1))
print(df.head())
df_test.head()
   PassengerId  Survived  Pclass  \
0            1         0       3   
1            2         1       1   
2            3         1       3   
3            4         1       1   
4            5         0       3   

                                                Name     Sex   Age  SibSp  \
0                            Braund, Mr. Owen Harris    male  22.0      1   
1  Cumings, Mrs. John Bradley (Florence Briggs Th...  female  38.0      1   
2                             Heikkinen, Miss. Laina  female  26.0      0   
3       Futrelle, Mrs. Jacques Heath (Lily May Peel)  female  35.0      1   
4                           Allen, Mr. William Henry    male  35.0      0   

   Parch            Ticket     Fare Cabin Embarked Cabin_Zone  Ticket_e  \
0      0         A/5 21171   7.2500   NaN        S          0         1   
1      0          PC 17599  71.2833   C85        C          C         1   
2      0  STON/O2. 3101282   7.9250   NaN        S          0         1   
3      0            113803  53.1000  C123        S          C         0   
4      0            373450   8.0500   NaN        S          0         0   

   Cabin_e Age_map    Fare_e  
0        0   20-25 -0.502445  
1        1   35-40  0.786845  
2        0   25-30 -0.488854  
3        1   35-40  0.420730  
4        0   35-40 -0.486337  
Out[266]:
  PassengerId Pclass Name Sex Age SibSp Parch Ticket Fare Cabin Embarked Cabin_e Age_map Fare_e
0 892 3 Kelly, Mr. James male 34.5 0 0 330911 7.8292 NaN Q 0 30-35 -0.490783
1 893 3 Wilkes, Mrs. James (Ellen Needs) female 47.0 1 0 363272 7.0000 NaN S 0 45-50 -0.507479
2 894 2 Myles, Mr. Thomas Francis male 62.0 0 0 240276 9.6875 NaN Q 0 60+ -0.453367
3 895 3 Wirz, Mr. Albert male 27.0 0 0 315154 8.6625 NaN S 0 25-30 -0.474005
4 896 3 Hirvonen, Mrs. Alexander (Helga E Lindqvist) female 22.0 1 1 3101298 12.2875 NaN S 0 20-25 -0.401017
In [267]:
#部分变量哑编码,onehot独热码
df_x = pd.concat([df[['SibSp','Parch','Fare']], pd.get_dummies(df[['Pclass','Sex','Cabin','Embarked','Age_map']])],axis=1)#按照列黏连
df_y = df.Survived
df_test_x = pd.concat([df_test[['SibSp','Parch','Fare']], pd.get_dummies(df_test[['Pclass', 'Sex','Cabin','Embarked', 'Age_map']])],axis=1)
print(df_x.head())
df_test_x.head()
   SibSp  Parch     Fare  Pclass  Sex_female  Sex_male  Cabin_A10  Cabin_A14  \
0      1      0   7.2500       3           0         1          0          0   
1      1      0  71.2833       1           1         0          0          0   
2      0      0   7.9250       3           1         0          0          0   
3      1      0  53.1000       1           1         0          0          0   
4      0      0   8.0500       3           0         1          0          0   

   Cabin_A16  Cabin_A19      ...       Age_map_20-25  Age_map_25-30  \
0          0          0      ...                   1              0   
1          0          0      ...                   0              0   
2          0          0      ...                   0              1   
3          0          0      ...                   0              0   
4          0          0      ...                   0              0   

   Age_map_30-35  Age_map_35-40  Age_map_40-45  Age_map_45-50  Age_map_50-55  \
0              0              0              0              0              0   
1              0              1              0              0              0   
2              0              0              0              0              0   
3              0              1              0              0              0   
4              0              1              0              0              0   

   Age_map_55-60  Age_map_60+  Age_map_Null  
0              0            0             0  
1              0            0             0  
2              0            0             0  
3              0            0             0  
4              0            0             0  

[5 rows x 169 columns]
Out[267]:
  SibSp Parch Fare Pclass Sex_female Sex_male Cabin_A11 Cabin_A18 Cabin_A21 Cabin_A29 ... Age_map_20-25 Age_map_25-30 Age_map_30-35 Age_map_35-40 Age_map_40-45 Age_map_45-50 Age_map_50-55 Age_map_55-60 Age_map_60+ Age_map_Null
0 0 0 7.8292 3 0 1 0 0 0 0 ... 0 0 1 0 0 0 0 0 0 0
1 1 0 7.0000 3 1 0 0 0 0 0 ... 0 0 0 0 0 1 0 0 0 0
2 0 0 9.6875 2 0 1 0 0 0 0 ... 0 0 0 0 0 0 0 0 1 0
3 0 0 8.6625 3 0 1 0 0 0 0 ... 0 1 0 0 0 0 0 0 0 0
4 1 1 12.2875 3 1 0 0 0 0 0 ... 1 0 0 0 0 0 0 0 0 0

5 rows × 98 columns

In [ ]:
#缺失年龄填补
In [9]:
M=np.random.randn(2,3)      #i代表性别 j代表仓等级
for i in range(2):
    for j in range(3):
        M[i][j]=df[(df['Pclass']==j+1) & (df['Gender']==i)]['Age'].median()     #取中位数
M
Out[9]:
array([[ 35. ,  28. ,  21.5],
       [ 40. ,  30. ,  25. ]])
In [10]:
df['AgeFill']=df['Age']
print(len(df[df['Age'].isnull()][['Gender','Pclass','Age','AgeFill']]))
print(df[df['Age'].isnull()][['Gender','Pclass','Age','AgeFill']].head())
for i in range(2):
    for j in range(3):
        df.loc[df[(df['Pclass']==j+1) & (df['Gender']==i) & (df['Age'].isnull())].index,['AgeFill']]=M[i][j]    #.index取索引值
df[df['Age'].isnull()][['Gender','Pclass','Age','AgeFill']].head()
177
    Gender  Pclass  Age  AgeFill
5        1       3  NaN      NaN
17       1       2  NaN      NaN
19       0       3  NaN      NaN
26       1       3  NaN      NaN
28       0       3  NaN      NaN
Out[10]:
  Gender Pclass Age AgeFill
5 1 3 NaN 25.0
17 1 2 NaN 30.0
19 0 3 NaN 21.5
26 1 3 NaN 25.0
28 0 3 NaN 21.5
In [11]:
#--------------特征工程
df['familysize']=df['SibSp']+df['Parch']
df['Pclass*AgeFill']=df['Pclass']*df['AgeFill']
In [12]:
for i in df.dtypes:
    print (i)
int64
int64
int64
object
object
float64
int64
int64
object
float64
object
object
int64
float64
int64
float64
In [13]:
#df=df.drop(['Pclass*Age'],axis=1)  丢弃一列
print(df.dtypes)
df.dtypes[df.dtypes.map(lambda x: x=='object')]
PassengerId         int64
Survived            int64
Pclass              int64
Name               object
Sex                object
Age               float64
SibSp               int64
Parch               int64
Ticket             object
Fare              float64
Cabin              object
Embarked           object
Gender              int64
AgeFill           float64
familysize          int64
Pclass*AgeFill    float64
dtype: object
Out[13]:
Name        object
Sex         object
Ticket      object
Cabin       object
Embarked    object
dtype: object
In [14]:
df=df.drop(['Name','Sex','Age','Ticket','Cabin','Embarked'],axis=1)
df.head()
Out[14]:
  PassengerId Survived Pclass SibSp Parch Fare Gender AgeFill familysize Pclass*AgeFill
0 1 0 3 1 0 7.2500 1 22.0 1 66.0
1 2 1 1 1 0 71.2833 0 38.0 1 38.0
2 3 1 3 0 0 7.9250 0 26.0 0 78.0
3 4 1 1 1 0 53.1000 0 35.0 1 35.0
4 5 0 3 0 0 8.0500 1 35.0 0 105.0
In [15]:
from sklearn.cross_validation import train_test_split
from sklearn.linear_model.logistic import LogisticRegression
from sklearn import preprocessing
import seaborn as sns
feature_names=['Pclass','SibSp','Parch','Fare','Gender','AgeFill','familysize','Pclass*AgeFill']
X=df[feature_names]
Y=df['Survived']
X_train,X_test,y_train,y_test=train_test_split(X,Y,test_size=0.3,random_state=0) #7:3拆分  
lr_model=LogisticRegression()
lr_model.fit(X_train,y_train)
y_pred_score=lr_model.predict_proba(X_test)
y_pred_score[:10]
D:\Anaconda3\lib\site-packages\sklearn\cross_validation.py:41: DeprecationWarning: This module was deprecated in version 0.18 in favor of the model_selection module into which all the refactored classes and functions are moved. Also note that the interface of the new CV iterators are different from that of this module. This module will be removed in 0.20.
  "This module will be removed in 0.20.", DeprecationWarning)
Out[15]:
array([[ 0.857523  ,  0.142477  ],
       [ 0.86057444,  0.13942556],
       [ 0.9224654 ,  0.0775346 ],
       [ 0.10549417,  0.89450583],
       [ 0.41466724,  0.58533276],
       [ 0.59148554,  0.40851446],
       [ 0.0714005 ,  0.9285995 ],
       [ 0.06661603,  0.93338397],
       [ 0.6030931 ,  0.3969069 ],
       [ 0.28987151,  0.71012849]])
In [16]:
#from sklearn.metrics import roc_curve
import sklearn
import matplotlib.pyplot as plt
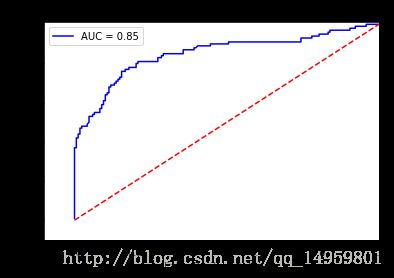
fpr,tpr,thresholds=sklearn.metrics.roc_curve(y_test,y_pred_score[:,1])#注意阈值  
roc_auc=sklearn.metrics.auc(fpr,tpr)
plt.title('Receiver Operating Characteristic')
plt.plot(fpr,tpr,'b',label='AUC = %0.2f'%roc_auc)
plt.legend(loc='lower right')
plt.plot([0,1],[0,1],'r--')
plt.xlim([-0.1,1.0])
plt.ylim([-0.1,1.01])
plt.ylabel('True Positive Rate')
plt.xlabel('False Positive Rate')
plt.show()
D:\Anaconda3\lib\site-packages\matplotlib\legend.py:326: UserWarning: Unrecognized location "lower right". Falling back on "best"; valid locations are
	best
	upper right
	upper left
	lower left
	lower right
	right
	center left
	center right
	lower center
	upper center
	center

  six.iterkeys(self.codes))))
  Kaggle实战——泰坦尼克生存预测大赛_第17张图片
In [17]:
df=df.dropna()    #有空值存在的所有行
train_data=df.values
train_data
Out[17]:
array([[   1. ,    0. ,    3. , ...,   22. ,    1. ,   66. ],
       [   2. ,    1. ,    1. , ...,   38. ,    1. ,   38. ],
       [   3. ,    1. ,    3. , ...,   26. ,    0. ,   78. ],
       ..., 
       [ 889. ,    0. ,    3. , ...,   21.5,    3. ,   64.5],
       [ 890. ,    1. ,    1. , ...,   26. ,    0. ,   26. ],
       [ 891. ,    0. ,    3. , ...,   32. ,    0. ,   96. ]])
In [18]:
#使用网格搜索最佳模型参数!!!!!!  X_train,X_test,y_train,y_test
from sklearn.model_selection import GridSearchCV
base_line_model = LogisticRegression()
param = {'penalty':['l1','l2'], 
        'C':[0.1, 0.5, 1.0,5.0]}
grd = GridSearchCV(estimator=base_line_model, param_grid=param, cv=5, n_jobs=3)
grd.fit(X_train,y_train)
grd.best_estimator_
Out[18]:
LogisticRegression(C=0.1, class_weight=None, dual=False, fit_intercept=True,
          intercept_scaling=1, max_iter=100, multi_class='ovr', n_jobs=1,
          penalty='l1', random_state=None, solver='liblinear', tol=0.0001,
          verbose=0, warm_start=False)
In [27]:
from sklearn.model_selection import learning_curve
from sklearn.utils import shuffle
X_train, y_train = shuffle(X_train, y_train)
def plot_learning_curve(clf, title, X, y, ylim=None, cv=None, n_jobs=3, train_sizes=np.linspace(.05, 1., 5)):
    train_sizes, train_scores, test_scores = learning_curve(
        clf, X, y, train_sizes=train_sizes)
    train_scores_mean = np.mean(train_scores, axis=1)
    train_scores_std = np.std(train_scores, axis=1)
    test_scores_mean = np.mean(test_scores, axis=1)
    test_scores_std = np.std(test_scores, axis=1)
    
    ax = plt.figure().add_subplot(111)
    ax.set_title(title)
    if ylim is not None:
        ax.ylim(*ylim)
    ax.set_xlabel(u"train_num_of_samples")
    ax.set_ylabel(u"score")

    ax.fill_between(train_sizes, train_scores_mean - train_scores_std, train_scores_mean + train_scores_std, 
                     alpha=0.1, color="b")
    ax.fill_between(train_sizes, test_scores_mean - test_scores_std, test_scores_mean + test_scores_std, 
                     alpha=0.1, color="r")
    ax.plot(train_sizes, train_scores_mean, 'o-', color="b", label=u"train score")
    ax.plot(train_sizes, test_scores_mean, 'o-', color="r", label=u"testCV score")

    ax.legend(loc="best")

    midpoint = ((train_scores_mean[-1] + train_scores_std[-1]) + (test_scores_mean[-1] - test_scores_std[-1])) / 2
    diff = (train_scores_mean[-1] + train_scores_std[-1]) - (test_scores_mean[-1] - test_scores_std[-1])
    return midpoint, diff

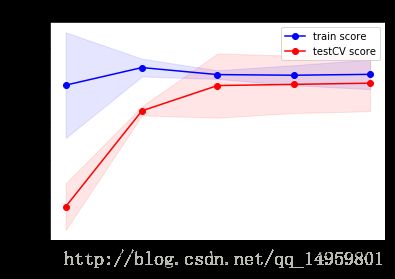
plot_learning_curve(grd, u"learning_rate", X_train, y_train)
D:\Anaconda3\lib\site-packages\sklearn\model_selection\_split.py:597: Warning: The least populated class in y has only 2 members, which is too few. The minimum number of members in any class cannot be less than n_splits=5.
  % (min_groups, self.n_splits)), Warning)
Out[27]:
(0.79962671354141879, 0.069011468383558872)
In [28]:
plt.show()
  Kaggle实战——泰坦尼克生存预测大赛_第18张图片
In [44]:
#from sklearn.metrics import roc_curve
import sklearn
import matplotlib.pyplot as plt
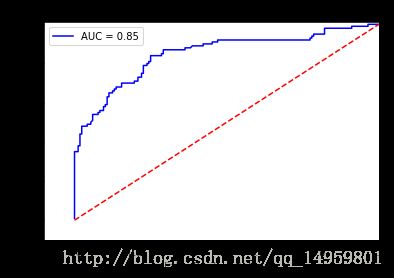
fpr,tpr,thresholds=sklearn.metrics.roc_curve(y_test,grd.predict_proba(X_test)[:,1],pos_label=1)#grd可以预测
roc_auc=sklearn.metrics.auc(fpr,tpr)
plt.title('Receiver Operating Characteristic')
plt.plot(fpr,tpr,'b',label='AUC = %0.2f'%roc_auc)
plt.legend(loc='lower right')
plt.plot([0,1],[0,1],'r--')
plt.xlim([-0.1,1.0])
plt.ylim([-0.1,1.01])
plt.ylabel('True Positive Rate')
plt.xlabel('False Positive Rate')
plt.show()
D:\Anaconda3\lib\site-packages\matplotlib\legend.py:326: UserWarning: Unrecognized location "lower right". Falling back on "best"; valid locations are
	best
	upper right
	upper left
	lower left
	lower right
	right
	center left
	center right
	lower center
	upper center
	center

  six.iterkeys(self.codes))))
  Kaggle实战——泰坦尼克生存预测大赛_第19张图片
In [45]:
#使用grd模型生成预测结果 并存入CSV
#df_test=pd.read_csv('D:/In/kaggle/Titanic/test.csv')
gender_submission = pd.DataFrame({'PassengerId':X_test.index,'Survived':grd.predict(X_test)})
gender_submission.to_csv('C://Users//zhangshuai_lc//submission_first.csv', index=None)

你可能感兴趣的:(大数据练兵场,sklearn,seaborn,pandas,kaggle,泰坦尼克号)