plt注释文字,美化及实战
注释
如何给图片添加注释

需要用到plt.annotate("",xy=() ,xytext =(),arrowprops = dict),分别是注释的内容,xy是箭头指向的坐标,xytext是文字起始的坐标,arrowprops(箭头)里面的参数:facecolor:颜色,frac是箭头的比例0-1,1是全部是箭头,0.5是一半都是箭头,0就是没有箭头,headwidth:箭头的宽度,width:键身的宽度

如果在图中只画文字(没有箭头)

使用plt.text()里面的参数第一个是横坐标,第一个是纵坐标

重要参数:
family:字体.family = “”
size : 字体尺寸。size = 20
color:文字颜色。clolr = “”
style:斜体style = ""只有两种,italic和oblique
weigth文字粗细,weight = 20(范围0-1000)
tex公式
matplotlib自带mathtext引擎,不需要安装TeX系统

小知识:r""这样会不转义

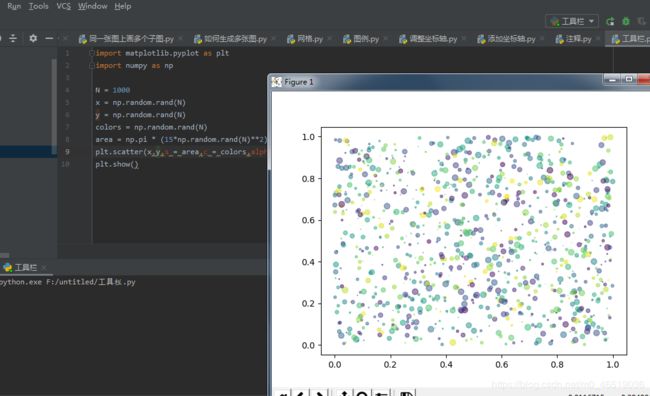
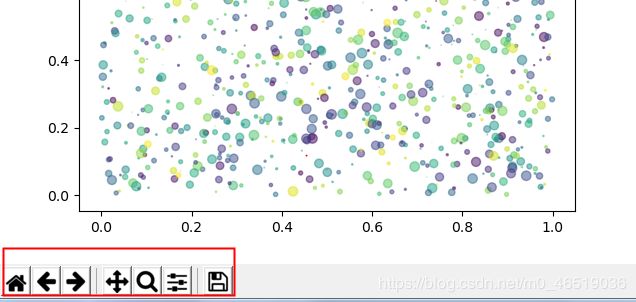
工具栏
区域填充(白块区域上色)
需要用到fill函数
我们画了两条sin函数

然后用fill函数

因为我们先写的fill(x,y1),所以红色的线会把蓝色的覆盖掉,如果我们想把蓝色和红色同时显示出来,需要添加一个透明度

我们可以发现,用fill填充的时候,是填充所画的线与X轴的范围,如果我们想填充两根线之间的区域

可以使用fill_between()

如果我们想区分一下当第一条线在上面的时候的颜色和第二条线在上面时候的颜色,可以

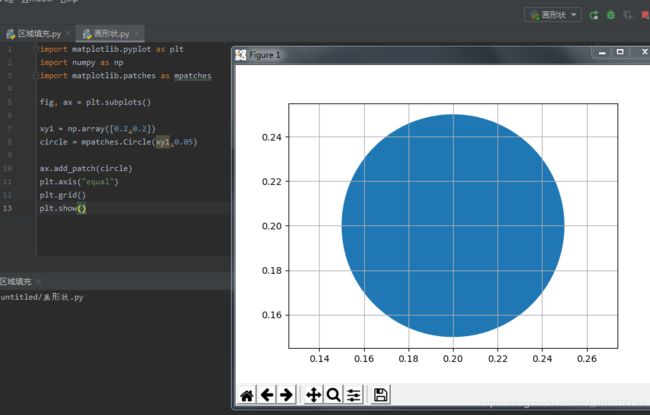
如何直接画一个填充好的形状
极坐标

如何实现这样的图形
首先我们需要使用plt.subplot里面的参数:projection(投影),polar(极坐标),projection = “polar”

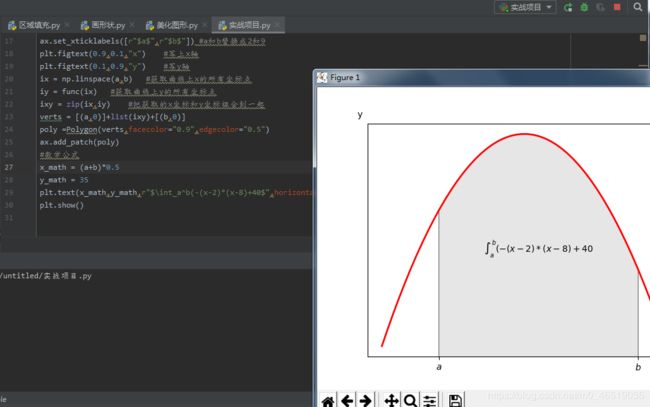
实战项目:函数积分图
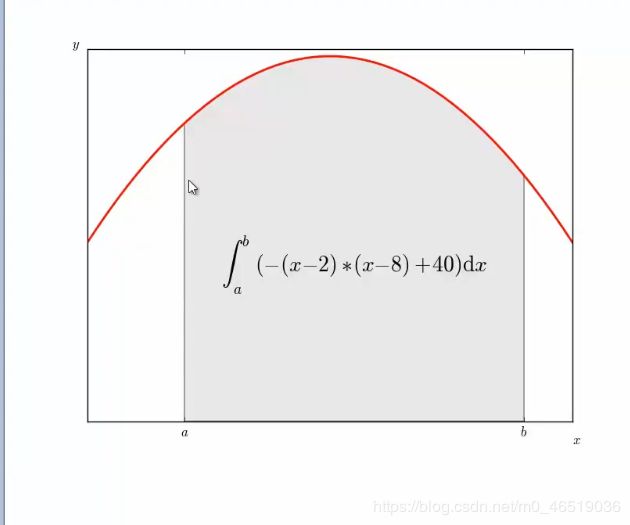
首先画出线
import matplotlib.pyplot as plt
import numpy as np
def func(x):
return -(x-2)*(x-8)+40
x = np.linspace(0,10)
y = func(x)
fig, ax = plt.subplots()
plt.plot(x,y,“r”,linewidth = 2)
a = 2
b = 9
然后需要把刻度重新设置一下
ax.set_xticks([a,b]) #设置刻度,x显示a和b的值(2和9)
ax.set_yticks([]) #设置y刻度,全部都清空
ax.set_xticklabels([r" a a a",r" b b b"]) #a和b替换成2和9
plt.figtext(0.9,0.1,“x”) #写上x轴
plt.figtext(0.1,0.9,“y”) #写y轴

现在开始画积分的区域
首先,我们画灰色的阴影,观察得到,阴影是一个多边形,多边形由(a,0),(b,0)和所有曲线上的点组成

最后就是数学公式,首先我们来确定他的位置
x_math = (a+b)*0.5
y_math = 35
plt.text(x_math,y_math,r" ∫ a b ( − ( x − 2 ) ∗ ( x − 8 ) + 40 \int_a^b(-(x-2)*(x-8)+40 ∫ab(−(x−2)∗(x−8)+40",horizontalalignment = “center”)
plt.show()
这里有一个参数,horizontalalignment,当这个参数等于center 的时候,就是自动对齐,不用再去调位置。
散点图-条形图
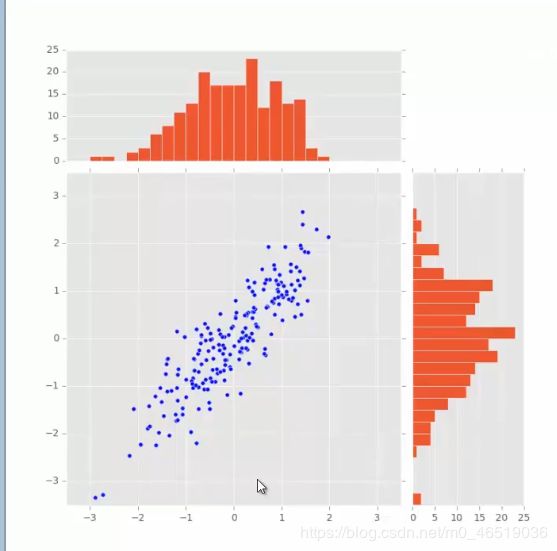
在散点图的x轴和y轴上分别画了他们的条形图,来表示x或者y轴上散点图的分布情况
如果做这样的图,我们先观察整体的布局,观察每个小图的位置,定义好坐标以用于自定义小图
import matplotlib.pyplot as plt
import numpy as np
plt.style.use(“ggplot”)
x = np.random.randn(200)
y = x+np.random.randn(200)*0.5
margin_border = 0.1
width = 0.6
margin_between = 0.02
height = 0.2
left_s = margin_border
bottom_s = margin_border
height_s = width
width_s = width
left_x = margin_border
bottom_x = margin_border+width+margin_between
height_x = height
width_x = width
left_y = margin_border+width+margin_between
bottom_y = margin_border
height_y = width
width_y = height
之后生成画布
plt.figure(1,figsize=(8,8)) #画布
rect_s = [left_s,bottom_s,width_s,height_s]
rect_x = [left_x,bottom_x,width_x,height_x]
rect_y = [left_y,bottom_y,width_y,height_y]
axScatter = plt.axes(rect_s)
axHisX = plt.axes(rect_x)
axHisY = plt.axes(rect_y)

画完之后我们发现数字坐标有一些重合,先把没有用的数字标签去掉
axHisX.set_xticks([])
axHisY.set_xticks([])

现在开始画图
axScatter.scatter(x,y) #散点图
bin_width = 0.25
xymax = np.max([np.max(np.fabs(x)),np.max(np.fabs(y))])
lim = int(xymax/bin_width+1)*bin_width
axScatter.set_xlim(-lim,lim)
axScatter.set_ylim(-lim,lim)
bins = np.arange(-lim,lim+bin_width,bin_width)
axHisX.hist(x,bins = bins)
axHisY.hist(y,bins = bins,orientation = “horizontal”)
axHisX.set_xlim(axScatter.get_xlim())
axHisY.set_ylim(axScatter.get_xlim())

