Novel Robust Band-Limited Signal Detection Approach Using Graph
Novel Robust Band-Limited Signal Detection Approach Using Graph
目录
- Novel Robust Band-Limited Signal Detection Approach Using Graph
- Paper Download
- Abstract
- Implemention
- 一、信号的生成
- 二、计算功率谱 X ( m ) X(m) X(m),并归一化
- 三、量化
- 四、构建邻接矩阵、度矩阵和拉普拉斯矩阵
- 五、计算Laplacian Matrix 的第二大特征值及其均值
- 六、判断
- Question
Paper Download
原文百度云及提取码:9tok
Abstract
Abstract— In this letter, a novel graph-based adequate and concise information representation paradigm is explored. This new signal representation framework can provide a promising alternative for manifesting the essential structure of the communication signals. A typical application, namely, band-limited signal detection, can thus be carried out using our proposed new graph-based signal characterization. According to Monte Carlo simulation results, the proposed graph-based signal detection method leads to the outstanding performance, compared with other existing techniques especially when the signal-to-noise ratio is rather small.
Index Terms— Graph representation, cyclic spectral analysis,sparse signal, weak signal detection.
Implemention
BY MYSELF
一、信号的生成
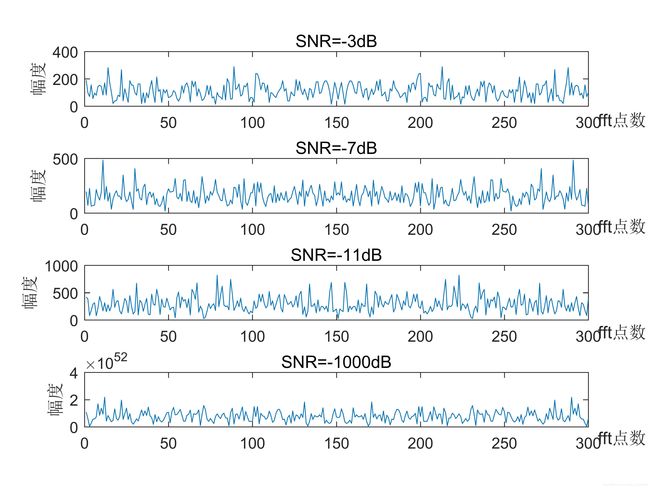
根据文中叙述,使用BPSK进行作为实验数据,信噪比分别是-3dB、-7dB、-11dB、- ∞ \infty ∞dB:
Matlab自带有pskmod函数:
function y = pskmod(x,M,varargin)
%PSKMOD Phase shift keying modulation
%
%   Y = PSKMOD(X,M) outputs the complex envelope of the modulation of the
%   message signal X, using the phase shift keying modulation. M is the
%   alphabet size and must be an integer power or 2. The message signal X
%   must consist of integers between 0 and M-1. For two-dimensional
%   signals, the function treats each column as 1 channel.
%
%   Y = PSKMOD(X,M,INI_PHASE) specifies the desired initial phase in
%   INI_PHASE. The default value of INI_PHASE is 0.
%
%   Y = PSKMOD(X,M,INI_PHASE,SYMBOL_ORDER) specifies how the function
%   assigns binary words to corresponding integers. If SYMBOL_ORDER is set
%   to 'bin' (default), then the function uses a natural binary-coded ordering.
%   If SYMBOL_ORDER is set to 'gray', then the function uses a Gray-coded
%   ordering.
%
%   See also PSKDEMOD, MODNORM, comm.PSKModulator.

%    Copyright 1996-2013 The MathWorks, Inc.
我们可以直接调用基带调制:
MPSK=2;
msg=randi([0 MPSK-1],1,nsymbol); %生成基带数据
msgmod=pskmod(msg,MPSK).'; %基带B-PSK调制
然后再通过载波进行搬移:
T0=1;%符号周期
fs=50/T0;%采样率
t=0:1/fs:T0-1/fs;%时间向量
fc=2/T0; %载波频率
c=sqrt(2)*exp(1i*2*pi*fc*t);%载波信号
tx=real(msgmod*c);%载波调制
然后对所得信号进行展开,方便后续计算:
tx1=reshape(tx.',1,length(msgmod)*length(c)); %tx'的每一列是一个码元代表的采样点,现展开为一行
现在所得信号是没有噪声的。我们通过SNR和信号功率计算噪声功率,并将信号和其对应的噪声相加,完成信号的模拟:
for indx=1:length(snr_dB)
    rx=noisegen(tx1,snr_dB(indx),T0,fs); %加入高斯白噪声后的信号
    rxy=abs(fft(rx,300));%fft
    figure(1)%显示fft图像
    subplot(4,1,indx)
    plot(rxy);
    title(['SNR=',num2str(snr_dB(indx)),'dB']);
    xlabel('fft点数','position',[320 -20]);
    ylabel('幅度');
end
其中noisegen函数是根据此PAPER自定义的噪声计算及添加。
到此完成信号生成(变换到频域)如下:

二、计算功率谱 X ( m ) X(m) X(m),并归一化
归一化公式:
U X ( m ) = X ( m ) − θ m i n θ m a n − θ m a n , m = 0 , 1 , . . . M − 1 U_X(m)= \frac{X(m)-\theta_{min}}{\theta_{man}-\theta_{man}} , m=0,1,...M-1 UX(m)=θman−θmanX(m)−θmin,m=0,1,...M−1
其中 X ( m ) X(m) X(m)是功率谱, θ m a x \theta_{max} θmax和 θ m i n \theta_{min} θmin是功率谱的最大值和最小值。
使用FFT计算得到功率谱 X ( m ) X(m) X(m):
X ( m ) = d e f 1 K ∣ ∑ k = 0 K − 1 x ( k ) e − j 2 π m k K ∣ 2 , 0 ≤ m ≤ M − 1 X(m)\overset{def}{=}\frac{1}{K}|\sum_{k=0}^{K-1}x(k)e^{-j2\pi m\frac{k}{K}}|^2,0\leq m\le M-1 X(m)=defK1∣k=0∑K−1x(k)e−j2πmKk∣2,0≤m≤M−1
rxy=abs(fft(rx,300));%fft
Ux=zeros(1,length(rxy));
%%%%%%%%%
%Normalized
%%%%%%%%%
theta_min=min(rxy);
theta_max=max(rxy);
for m=1:1:length(rxy)
	Ux(m)=(rxy(m)- sita_min)/(sita_max-sita_min);
end
三、量化
根据论文量化规则:
Q X ( m ) = d e f △ γ ( U X ( m ) ) , m = 0 , 1 , . . . , M − 1 Q_X(m)\overset{def}{=}\triangle_\gamma(U_X(m)),m=0,1,...,M-1 QX(m)=def△γ(UX(m)),m=0,1,...,M−1
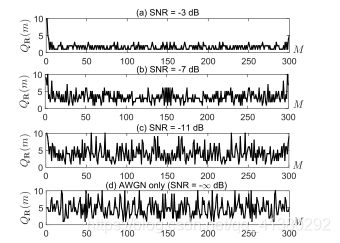
得到量化结果:
%%%%%%%%%%%
%quantization
%%%%%%%%%%%
for mm=1:1:length(Ux)
	[~,r_level(mm)]=min(abs(Ux(mm)-r_set));%找到量化等级
end
以此步骤画图得到Fig.1
四、构建邻接矩阵、度矩阵和拉普拉斯矩阵
根据论文可总结为:
A ~ ( Q X ( m ) , Q X ( m + 1 ) ) = 1 , m = 1 , 2 , . . . , M − 1 \widetilde{A}(Q_X(m),Q_X(m+1))=1,m=1,2,...,M-1 A (QX(m),QX(m+1))=1,m=1,2,...,M−1
再通过线性代数定理得到Laplacian Matrix:
L = D − A L=D-A L=D−A
其中 L L L是Laplacian, D D D 是Degree Matrix, A A A是 Adjacency Matrix
这里用一个自己定义的函数get_LaplacianMatrix来实现:
function Lx=get_LaplacianMatrix(r,Qx)
Ax_bar=zeros(r,r);
Dx_bar=zeros(r,r);
for i =1:1:length(Qx)-1
    if(Qx(i)~=Qx(i+1))
        Ax_bar(Qx(i),Qx(i+1))=1; %半正定矩阵
        Ax_bar(Qx(i+1),Qx(i))=1;
    end
end
for j=1:1:r
   Dx_bar(j,j)=sum(Ax_bar(j,:));
end
Lx=Dx_bar-Ax_bar;
五、计算Laplacian Matrix 的第二大特征值及其均值
求拉普拉斯矩阵Lx的特征值,记第二大特征值为 λ 1 \lambda_1 λ1。完成1000次计算,得到均值:
λ ˉ 1 = 1 ψ ∑ ν = 1 ψ λ 1 ( ν ) \bar{\lambda}_1= \frac{1}{\psi}\sum_{\nu=1}^{\psi}\lambda_1(\nu) λˉ1=ψ1ν=1∑ψλ1(ν)
Lx=get_LaplacianMatrix(r,r_level);%得到laplacian 矩阵
[~,lamda]=eig(Lx);%计算特征值
[not_sort,~]=max(lamda);%提取特征值
lamda_sort=sort(not_sort);%特征值排序
lamda0(indx2)=lamda_sort(end-1);%找到第二大特征值
六、判断
根据文中理论,全联通图的 λ ˉ 1 \bar{\lambda}_1 λˉ1应该等于量化等级 γ \gamma γ:
lim x → ∞ λ 1 = γ {\lim_{x \to \infty}}\lambda_1=\gamma x→∞limλ1=γ即信噪比很小或全是白噪声时, ∣ λ 1 − γ ∣ < δ |\lambda_1-\gamma|<\delta ∣λ1−γ∣<δ。 δ \delta δ是一个很小门限参数。
此处定理有待证明。。。
Question
此篇文章出了一个大BUG,通过SNR计算噪声功率出现了错误。

可见,文章中的信噪比添加方式是错误的,没有考虑白噪声的功率谱。
完整代码见My Github Give me a star plz!


