caffe可视化各层feature map(附python脚本)
通过查看各层feature map可以更好地观察各层的输出,以及各层的效果。
代码:
# -*- coding: utf-8 -*-

import sys
sys.path.append("/data_1/SSD/caffe/python")
import numpy as np
import matplotlib.pyplot as plt
import os
import pickle
import cv2
import Image as img
from skimage import io,transform
caffe_root='/data_1/SSD/caffe'

sys.path.insert(0,caffe_root+'python')
import caffe

deployPrototxt =  '/data_1/SSD/caffe/models/VGGNet/VOC0712/SSD_300x300/deploy.prototxt'
modelFile = '/data_1/SSD/caffe/models/VGGNet/VOC0712/SSD_300x300/VGG_VOC0712_SSD_300x300_iter_18.caffemodel'
meanFile = ''

#网络初始化
def initilize():
    print 'initilize ... '
    sys.path.insert(0, caffe_root + 'python')
    caffe.set_mode_gpu()
    caffe.set_device(0)
    net = caffe.Net(deployPrototxt, modelFile,caffe.TEST)
    return net

# 此处将卷积图和进行显示,
def vis_square(data, padsize=1, padval=0):
    data -= data.min()
    data /= data.max()

    print data[0:1].shape

    #让合成图为方
    n = int(np.ceil(np.sqrt(data.shape[0])))
    padding = ((0, n ** 2 - data.shape[0]), (0, padsize), (0, padsize)) + ((0, 0),) * (data.ndim - 3)
    data = np.pad(data, padding, mode='constant', constant_values=(padval, padval))

    #合并卷积图到一个图像中
    data = data.reshape((n, n) + data.shape[1:]).transpose((0, 2, 1, 3) + tuple(range(4, data.ndim + 1)))
    data = data.reshape((n * data.shape[1], n * data.shape[3]) + data.shape[4:])
    #print data.shape
    plt.imshow(data)

#def getforward_net(image,net):
    ## input preprocessing: 'data' is the name of the input blob == net.inputs[0]
    #transformer = caffe.io.Transformer({'data': net.blobs['data'].data.shape})
    #transformer.set_transpose('data', (2,0,1))
    ##transformer.set_mean('data', np.load(caffe_root + meanFile ).mean(1).mean(1)) # mean pixel
    ##transformer.set_raw_scale('data', 255)
    ##the reference model operates on images in [0,255] range instead of [0,1]
    ##transformer.set_channel_swap('data', (2,1,0))
    ## the reference model has channels in BGR order instead of RGB
    ## set net to batch size of 50
    #net.blobs['data'].reshape(1,3,64,64)
    #net.blobs['data'].reshape(1,1,28,28)

    #net.blobs['data'].data[...] = transformer.preprocess('data',caffe.io.load_image(image,False) )
    #out = net.forward()


def getforward_net(image,net):
    # input preprocessing: 'data' is the name of the input blob == net.inputs[0]
    transformer = caffe.io.Transformer({'data': net.blobs['data'].data.shape})
    transformer.set_transpose('data', (2,0,1))
    #transformer.set_mean('data', np.load(caffe_root + meanFile ).mean(1).mean(1)) # mean pixel
    transformer.set_raw_scale('data', 255)
    # the reference model operates on images in [0,255] range instead of [0,1]
    transformer.set_channel_swap('data', (2,1,0))
    # the reference model has channels in BGR order instead of RGB
    # set net to batch size of 50
    net.blobs['data'].reshape(1,3,300,300)

    net.blobs['data'].data[...] = transformer.preprocess('data', caffe.io.load_image(image))
    out = net.forward()

#取出网络中的params和net.blobs的中的数据
def getNetDetails(image, net):

    image_data=plt.imread(image)

    plt.figure("Image")
    plt.imshow(image_data)

    getforward_net(image,net)
    #网络提取conv1的卷积核
    """
    filters = net.params['conv1_1'][0].data
    with open('FirstLayerFilter.pickle','wb') as f:
       pickle.dump(filters,f)
    vis_square(filters.transpose(0, 2, 3, 1))
    """


    feat = net.blobs['data'].data[0, :3]
    plt.figure("data")
    vis_square(feat,padval=1)

    feat = net.blobs['conv9_1'].data[0, :256]
    plt.figure("conv9_1")
    vis_square(feat,padval=1)
    #vis_square(feat)

    #feat = net.blobs['conv1_2'].data[0, :20]
    #plt.figure("conv1_2")
    #vis_square(feat,padval=1)


    #feat = net.blobs['conv2_1'].data[0, :20]
    #plt.figure("conv2_1")
    #vis_square(feat,padval=1)

    #feat = net.blobs['conv2_2'].data[0, :20]
    #plt.figure("conv2_2")
    #vis_square(feat,padval=1)

    #feat = net.blobs['loc_conv2'].data[0, :32]
    #plt.figure("loc_conv2")
    #vis_square(feat,padval=1)

    #feat = net.blobs['st_output'].data[0]
    #plt.figure("st_output")
    #vis_square(feat,padval=1)

   # feat = net.blobs['conv3'].data[0]
    #plt.figure("conv3")
    #vis_square(feat,padval=1)

    #print 'loc_ip1:\n', net.blobs['loc_ip1'].data
    #print 'theta:\n', net.blobs['theta'].data
    #print 'class:\n', net.blobs['class'].data
    #print 'conv3:\n', net.blobs['conv2'].data
    #print 'feat:\n', net.blobs['feat'].data

    #conv1_1的特征图
    # feat = net.blobs['conv1_1'].data[0, :64]
    # plt.figure("conv1_1")
    # vis_square(feat,padval=1)

    # feat = net.blobs['conv1_2_D'].data[0, :34]
    # plt.figure("conv1_2_D")
    # vis_square(feat,padval=1)

    """
    #conv1_1的特征图
    feat = net.blobs['fc8_1'].data[0, :512]
    plt.figure("fc8_1")
    vis_square(feat,padval=1)

    #conv1_1的特征图
    feat = net.blobs['fc8_2'].data[0, :512]
    plt.figure("fc8_2")
    vis_square(feat,padval=1)

    #conv1_1的特征图
    feat = net.blobs['fc8_3'].data[0, :512]
    plt.figure("fc8_3")
    vis_square(feat,padval=1)

    #conv1_1的特征图
    feat = net.blobs['fc8_4'].data[0, :512]
    plt.figure("fc8_4")
    vis_square(feat,padval=1)

    #conv1_1的特征图
    feat = net.blobs['fc8'].data[0, :512]
    plt.figure("fc8")
    vis_square(feat,padval=1)
    """

    """
    #conv1_1的特征图
    feat = net.blobs['conv5_2'].data[0, :512]
    plt.figure("conv5_2")
    vis_square(feat,padval=1)
    #conv1_1的特征图
    feat = net.blobs['conv5_1'].data[0, :512]
    plt.figure("conv5_1")
    vis_square(feat,padval=1)


    #conv1_1的特征图
    feat = net.blobs['conv5_3'].data[0, :512]
    plt.figure("conv5_3")
    vis_square(feat,padval=1)

    #conv1_1的特征图
    feat = net.blobs['conv5_2'].data[0, :512]
    plt.figure("conv5_2")
    vis_square(feat,padval=1)
    #conv1_1的特征图
    feat = net.blobs['conv5_1'].data[0, :512]
    plt.figure("conv5_1")
    vis_square(feat,padval=1)

    #conv1_1的特征图
    feat = net.blobs['conv4_3'].data[0, :512]
    plt.figure("conv4_3")
    vis_square(feat,padval=1)

    #conv1_1的特征图
    feat = net.blobs['conv4_2'].data[0, :512]
    plt.figure("conv4_2")
    vis_square(feat,padval=1)

    #conv1_1的特征图
    feat = net.blobs['conv4_1'].data[0, :512]
    plt.figure("conv4_1")
    vis_square(feat,padval=1)

    #conv1_1的特征图
    feat = net.blobs['conv3_3'].data[0, :256]
    plt.figure("conv3_3")
    vis_square(feat,padval=1)

    #conv1_1的特征图
    feat = net.blobs['conv3_2'].data[0, :256]
    plt.figure("conv3_2")
    vis_square(feat,padval=1)

    #conv1_1的特征图
    feat = net.blobs['conv3_1'].data[0, :256]
    plt.figure("conv3_1")
    vis_square(feat,padval=1)

    #conv1_1的特征图
    feat = net.blobs['conv2_2'].data[0, :128]
    plt.figure("conv2_2")
    vis_square(feat,padval=1)

    #conv1_1的特征图
    feat = net.blobs['conv2_1'].data[0, :128]
    plt.figure("conv2_1")
    vis_square(feat,padval=1)

     #conv1_1的特征图
    feat = net.blobs['conv1_2'].data[0, :64]
    plt.figure("conv1_2")
    vis_square(feat,padval=1)

    #conv1_1的特征图
    feat = net.blobs['conv1_1'].data[0, :64]
    plt.figure("conv1_1")
    vis_square(feat,padval=1)
    """
    plt.show()

if __name__ == "__main__":
    net = initilize()
    testimage = '/data_1/SSD/caffe/examples/images/cat.jpg'
    getNetDetails(testimage, net)
需要修改的地方:
1、sys.path.append,修改为自己的python路径(本程序已SSD为例,则添加至SSD路径下python文件夹);
2、caffe_root,修改为SSD根目录;
3、deployPrototxt;
4、modelFile;(模型路径)
5、net.blobs['data'].reshape(1,3,300,300) ,网络输入图像尺寸(此处为SSD300*300);
6、feat = net.blobs['conv9_1'].data[0, :256] , 输出特征图的名称(256为通道数);
7、testimage;
ok,运行脚本即可查看了。
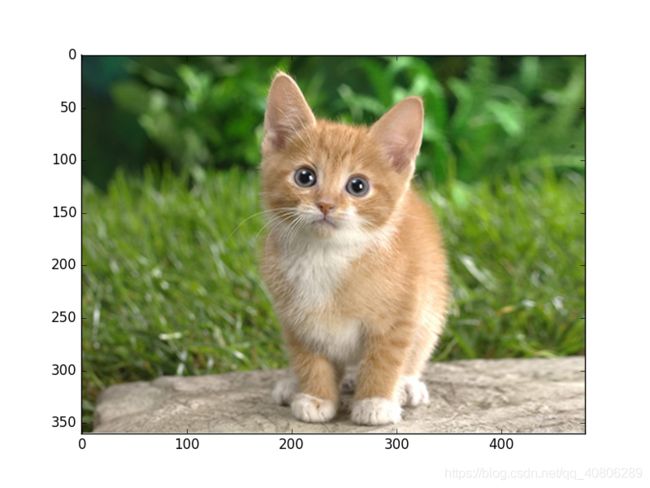
原图像(孤独无助可怜的猫)
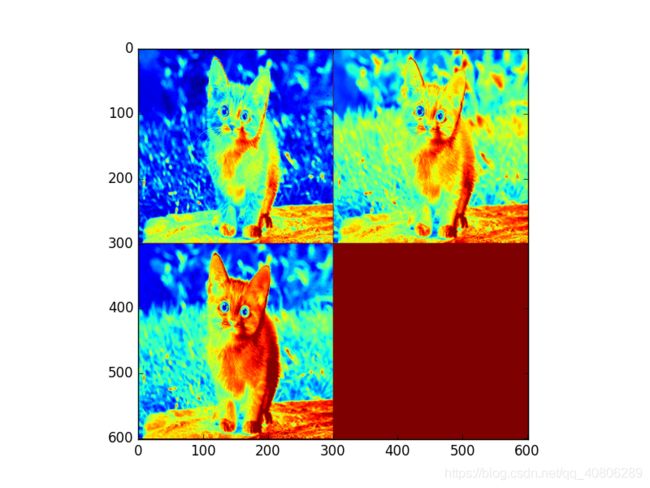
RGB三通道图像
SSD-CONV2_1
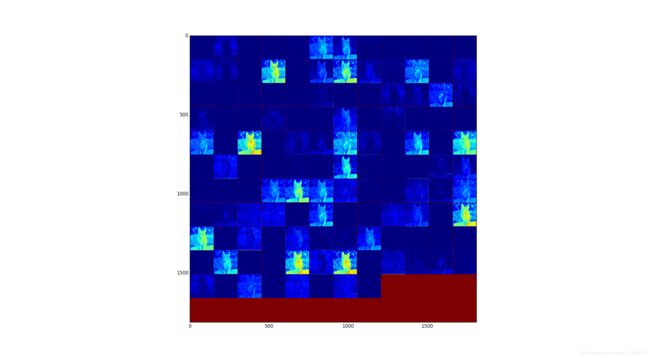
SSD-CONV9_1
从特征图conv2_1看出语义信息还不够充分,到了conv9_1语义信息充分提取。


