lenet and caffe-lenet
方法1:代码测试
下面的代码测试caffe-lenet中权重w,b以及bottom,up数据大小变化的情况。理解caffe-lenet中的具体实现。并对mnist数据集进行了测试。对于caffe生成的mean.binaryproto文件其在matlab中同样遵循[width * height *c]以及bgr模式。
实现需要的文件:
mnist数据集的 :mean.binaryproto文件,mnist_test 和mnist_test_label。
clearvars;close all;

if exist('../+caffe', 'dir')
    addpath('..');
else
    error('Please run this demo from caffe/matlab/demo');
end

%% load mnist_test_data and mean_file
% width * height * c  and bgr
mean_file = caffe.io.read_mean('mean.binaryproto');

load mnist_test.mat; %  mnist_test
load mnist_test_labels.mat; % mnist_test_labels


tnum = 6; % test_num

true_label = mnist_test_labels(1:tnum)';
test_img = reshape(mnist_test,[size(mnist_test,1) 28 28]);
test_img = permute(test_img,[3 2 1]); %交互三个维度。

test_img = test_img(:,:,1:tnum); % 可显示化的,height * width * nsamples

% convert [h * w * n] to [w * h * n]

test_img = permute(test_img,[2 1 3]);

% 减去均值文件

test_img = bsxfun(@minus,test_img,mean_file);

% 尺度化

test_img = test_img * 0.00390625; % 除以 255

%convert [w * h * n] to [w * h * c * n]

test_img = reshape(test_img,[size(test_img,1) size(test_img,2) 1 size(test_img,3)]);

%% 预测
net_model = 'lenet.prototxt';
net_weights = '1lenet_iter_10000.caffemodel';
phase = 'test';

net = caffe.Net(net_model, net_weights, phase);

% input_feature must be a cell
scores = net.forward({test_img});

scores = scores{1};

[~,max_label] = max(scores);

pre_label = max_label - 1; % 0 1 2 3 4 5 6 7 8 9
disp('pre_label:');
disp(pre_label);
disp('true_label:');
disp(true_label);

%% 将层的权重和偏移,以及输入,输出数据的大小打印出来。
% conv1 ==> bottom: "data"  top: "conv1"
% pool1 ==> bottom: "conv1" top: "pool1"
% conv2 ==> bottom: "pool1" top: "conv2"
% pool2 ==> bottom: "conv2" top: "pool2"
% ip1   ==> bottom: "pool2" top: "ip1"
% relu1 ==> bottom: "ip1"   top: "ip1
% ip2   ==> bottom: "ip1"   top: "ip2"
% prob  ==> bottom: "ip2"   top: "prob"

params = cell(8,3);
params{1,1} = 'conv1'; params{1,2} = 'data';  params{1,3} = 'conv1';
params{2,1} = 'pool1'; params{2,2} = 'conv1'; params{2,3} = 'pool1';
params{3,1} = 'conv2'; params{3,2} = 'pool1'; params{3,3} = 'conv2';
params{4,1} = 'pool2'; params{4,2} = 'conv2'; params{4,3} = 'pool2';
params{5,1} = 'ip1';   params{5,2} = 'pool2'; params{5,3} = 'ip1';
params{6,1} = 'relu1'; params{6,2} = 'ip1';   params{6,3} = 'ip1';
params{7,1} = 'ip2';   params{7,2} = 'ip1';   params{7,3} = 'ip2';
params{8,1} = 'prob';  params{8,2} = 'ip2';   params{8,3} = 'prob';

matlab_show = true;

% matlab中 权重w,偏置b,bottom和top数据格式如下,group = 1(default):
% w = [width * height * c * num_output1]  [width * height * num_output1 * num_output2] ...
% b = [num_output 1];
% bottom and top : [width * height * c * nsamples] [width * height * num_output1 * nsamples]...

disp('------------------------------------------------');
for i = 1:size(params,1)
    if strcmp(params{i,1}(1:end-1),'conv')  ||  strcmp(params{i,1}(1:end-1),'ip')
        conv1_layer_w = net.layers(params{i,1}).params(1).get_data();
        conv1_layer_b = net.layers(params{i,1}).params(2).get_data();
        if matlab_show == false
            % convert [width * height * c * n] to [n * c * height * witdh]
            conv1_layer_w = permute(conv1_layer_w,[4 3 2 1]);
        end
    elseif strcmp(params{i,1}(1:end-1),'pool')
        %conv1_layer_w = net.layers(params{i,1}).params(1).get_data();
    end

    bottom  = net.blobs(params{i,2}).get_data();
    top = net.blobs(params{i,3}).get_data();

    if matlab_show == false
        % convert [width * height * c * n] to [n * c * height * witdh]
        bottom = permute(bottom,[4 3 2 1]);
        top = permute(top,[4 3 2 1]);
    end

    if strcmp(params{i,1}(1:end-1),'conv')  || strcmp(params{i,1}(1:end-1),'ip')
        disp([params{i,1} '_layer: w: [' num2str(size(conv1_layer_w)) '] ;b: [' num2str(size(conv1_layer_b)) '] ']);
    end
    disp([ params{i,2} ': [' num2str(size(bottom)) '] ;' params{i,3} ': [' num2str(size(top)) ']']);

    disp('------------------------------------------------');
end
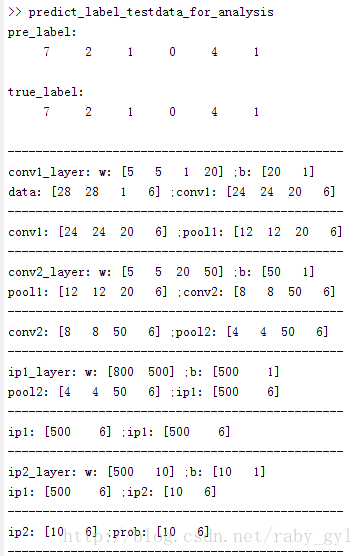
输出:
输出结果给出了测试的6个样本的预测标签和正确标签。以及各个层的参数大小和数据的大小。打印的方式采用matlab数据的存储方式。我们可以看到经过池化层后的数据为:pool2 : [4 4 50 6],紧接着是全连接层ip1_layer: w :[800 500],这里在prototxt中设置的num_output为500。我们可以看到: 800 = 4 * 4 * 50 ,因此是所有神经元都进行了连接,而没有像很多博客给的文中全连接层是通过进一步的卷积核(例如5*5(当然这里肯定不行)或者其他大小的卷积核)卷积实现的。
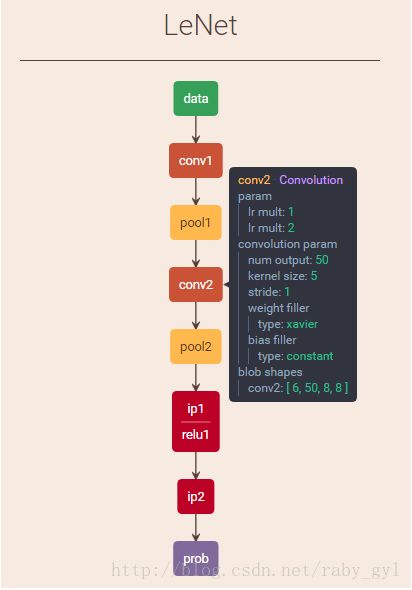
方法二:可视化工具
将下面的test协议复制到在线可视化工具,可以看到每个blob的大小。
name: "LeNet"
layer {
  name: "data"
  type: "Input"
  top: "data"
  input_param { shape: { dim: 6 dim: 1 dim: 28 dim: 28 } }
}
layer {
  name: "conv1"
  type: "Convolution"
  bottom: "data"
  top: "conv1"
  param {
    lr_mult: 1
  }
  param {
    lr_mult: 2
  }
  convolution_param {
    num_output: 20
    kernel_size: 5
    stride: 1
    weight_filler {
      type: "xavier"
    }
    bias_filler {
      type: "constant"
    }
  }
}
layer {
  name: "pool1"
  type: "Pooling"
  bottom: "conv1"
  top: "pool1"
  pooling_param {
    pool: MAX
    kernel_size: 2
    stride: 2
  }
}
layer {
  name: "conv2"
  type: "Convolution"
  bottom: "pool1"
  top: "conv2"
  param {
    lr_mult: 1
  }
  param {
    lr_mult: 2
  }
  convolution_param {
    num_output: 50
    kernel_size: 5
    stride: 1
    weight_filler {
      type: "xavier"
    }
    bias_filler {
      type: "constant"
    }
  }
}
layer {
  name: "pool2"
  type: "Pooling"
  bottom: "conv2"
  top: "pool2"
  pooling_param {
    pool: MAX
    kernel_size: 2
    stride: 2
  }
}
layer {
  name: "ip1"
  type: "InnerProduct"
  bottom: "pool2"
  top: "ip1"
  param {
    lr_mult: 1
  }
  param {
    lr_mult: 2
  }
  inner_product_param {
    num_output: 500
    weight_filler {
      type: "xavier"
    }
    bias_filler {
      type: "constant"
    }
  }
}
layer {
  name: "relu1"
  type: "ReLU"
  bottom: "ip1"
  top: "ip1"
}
layer {
  name: "ip2"
  type: "InnerProduct"
  bottom: "ip1"
  top: "ip2"
  param {
    lr_mult: 1
  }
  param {
    lr_mult: 2
  }
  inner_product_param {
    num_output: 10
    weight_filler {
      type: "xavier"
    }
    bias_filler {
      type: "constant"
    }
  }
}
layer {
  name: "prob"
  type: "Softmax"
  bottom: "ip2"
  top: "prob"
}

