用python对汽车油耗进行数据分析(anaconda python3.6完全跑通)
1.下载汽车油耗数据集并解压
下载地址:https://www.fueleconomy.gov/feg/download.shtml
vehiclesData.py:
#encoding = utf-8
import pandas as pd
import numpy as np
from ggplot import *
import matplotlib.pyplot as plt
vehicles = pd.read_csv("../data/vehicles.csv")
print(vehicles.head())
print(len(vehicles))#- 查看有多少观测点(行)和多少变量(列)
运行结果:
barrels08 barrelsA08 charge120 charge240 city08 city08U cityA08 \
0 15.695714 0.0 0.0 0.0 19 0.0 0
1 29.964545 0.0 0.0 0.0 9 0.0 0
2 12.207778 0.0 0.0 0.0 23 0.0 0
3 29.964545 0.0 0.0 0.0 10 0.0 0
4 17.347895 0.0 0.0 0.0 17 0.0 0
cityA08U cityCD cityE ... mfrCode c240Dscr charge240b \
0 0.0 0.0 0.0 ... NaN NaN 0.0
1 0.0 0.0 0.0 ... NaN NaN 0.0
2 0.0 0.0 0.0 ... NaN NaN 0.0
3 0.0 0.0 0.0 ... NaN NaN 0.0
4 0.0 0.0 0.0 ... NaN NaN 0.0
c240bDscr createdOn modifiedOn \
0 NaN Tue Jan 01 00:00:00 EST 2013 Tue Jan 01 00:00:00 EST 2013
1 NaN Tue Jan 01 00:00:00 EST 2013 Tue Jan 01 00:00:00 EST 2013
2 NaN Tue Jan 01 00:00:00 EST 2013 Tue Jan 01 00:00:00 EST 2013
3 NaN Tue Jan 01 00:00:00 EST 2013 Tue Jan 01 00:00:00 EST 2013
4 NaN Tue Jan 01 00:00:00 EST 2013 Tue Jan 01 00:00:00 EST 2013
startStop phevCity phevHwy phevComb
0 NaN 0 0 0
1 NaN 0 0 0
2 NaN 0 0 0
3 NaN 0 0 0
4 NaN 0 0 0
[5 rows x 83 columns]
39101
其中 pandas中Data Frame类的边界方法head,查看一个很有用的数据框data frame的中,包括每列的非空值数量和各列不同的数据类型的数量。
描述汽车油耗等数据
print(len(vehicles.columns))
print(vehicles.columns)
83
Index(['barrels08', 'barrelsA08', 'charge120', 'charge240', 'city08',
'city08U', 'cityA08', 'cityA08U', 'cityCD', 'cityE', 'cityUF', 'co2',
'co2A', 'co2TailpipeAGpm', 'co2TailpipeGpm', 'comb08', 'comb08U',
'combA08', 'combA08U', 'combE', 'combinedCD', 'combinedUF', 'cylinders',
'displ', 'drive', 'engId', 'eng_dscr', 'feScore', 'fuelCost08',
'fuelCostA08', 'fuelType', 'fuelType1', 'ghgScore', 'ghgScoreA',
'highway08', 'highway08U', 'highwayA08', 'highwayA08U', 'highwayCD',
'highwayE', 'highwayUF', 'hlv', 'hpv', 'id', 'lv2', 'lv4', 'make',
'model', 'mpgData', 'phevBlended', 'pv2', 'pv4', 'range', 'rangeCity',
'rangeCityA', 'rangeHwy', 'rangeHwyA', 'trany', 'UCity', 'UCityA',
'UHighway', 'UHighwayA', 'VClass', 'year', 'youSaveSpend', 'guzzler',
'trans_dscr', 'tCharger', 'sCharger', 'atvType', 'fuelType2', 'rangeA',
'evMotor', 'mfrCode', 'c240Dscr', 'charge240b', 'c240bDscr',
'createdOn', 'modifiedOn', 'startStop', 'phevCity', 'phevHwy',
'phevComb'],
dtype='object')
#查看年份信息
print(len(pd.unique(vehicles.year)))#总共的年份
print(min(vehicles.year))#最小年份
print(max(vehicles.year))#最大的年份
35
1984
2018
#查看变速箱类型
print(pd.value_counts(vehicles.trany))
#trany变量自动挡是以A开头,手动挡是以M开头;故创建一个新变量trany2:
vehicles["trany2"] = vehicles.trany.str[0]
print(pd.value_counts(vehicles.trany2))
Automatic 4-spd 11045
Manual 5-spd 8337
Automatic 3-spd 3151
Automatic (S6) 2857
Manual 6-spd 2563
Automatic 5-spd 2191
Automatic 6-spd 1521
Manual 4-spd 1483
Automatic (S8) 1181
Automatic (S5) 830
Automatic (variable gear ratios) 730
Automatic 7-spd 695
Automatic 8-spd 323
Automatic (AM-S7) 322
Automatic (S7) 288
Automatic (S4) 233
Automatic (AM7) 194
Automatic (AV-S6) 172
Automatic 9-spd 170
Automatic (A1) 134
Automatic (AM6) 122
Automatic (AM-S6) 106
Automatic (AV-S7) 95
Manual 7-spd 93
Manual 3-spd 77
Automatic (S9) 40
Automatic (AV-S8) 31
Automatic (S10) 30
Automatic (AM-S8) 26
Manual 4-spd Doubled 17
Automatic (AM5) 14
Automatic 10-spd 8
Automatic (AM8) 5
Automatic (L4) 2
Automatic (L3) 2
Automatic (AV-S10) 1
Automatic (AM-S9) 1
Name: trany, dtype: int64
A 26520
M 12570
Name: trany2, dtype: int64
同理可以查看其它特征数据
#分析汽车油耗随时间变化的趋势
#- 先按照年份分组
grouped = vehicles.groupby('year')
#- 再计算其中三列的均值
averaged= grouped['comb08', 'highway08', 'city08'].agg([np.mean])
#- 为方便分析,对其进行重命名,然后创建一个‘year’的列,包含该数据框data frame的索引
averaged.columns = ['comb08_mean', 'highwayo8_mean', 'city08_mean']
averaged['year'] = averaged.index
print(averaged )
comb08_mean highwayo8_mean city08_mean year
year
1984 19.881874 23.075356 17.982688 1984
1985 19.808348 23.042328 17.878307 1985
1986 19.550413 22.699174 17.665289 1986
1987 19.228549 22.445068 17.310345 1987
1988 19.328319 22.702655 17.333628 1988
1989 19.125759 22.465742 17.143972 1989
1990 19.000928 22.337662 17.033395 1990
1991 18.825972 22.253534 16.848940 1991
1992 18.862623 22.439786 16.805531 1992
1993 19.104300 22.780421 16.998170 1993
1994 19.012220 22.725051 16.918534 1994
1995 18.797311 22.671148 16.569804 1995
1996 19.584735 23.569211 17.289780 1996
1997 19.429134 23.451444 17.135171 1997
1998 19.518473 23.546798 17.113300 1998
1999 19.611502 23.552817 17.272300 1999
2000 19.526190 23.414286 17.221429 2000
2001 19.479693 23.328211 17.275521 2001
2002 19.168205 23.030769 16.893333 2002
2003 19.000958 22.836207 16.780651 2003
2004 19.067736 23.064171 16.740642 2004
2005 19.193825 23.297599 16.851630 2005
2006 18.959239 23.048913 16.626812 2006
2007 18.978686 23.083481 16.605684 2007
2008 19.276327 23.455771 16.900590 2008
2009 19.735195 24.017766 17.335025 2009
2010 20.589883 24.949413 18.106594 2010
2011 21.011525 25.170213 18.670213 2011
2012 21.820870 26.106957 19.365217 2012
2013 23.126164 27.502117 20.663844 2013
2014 23.518946 27.953871 21.029654 2014
2015 24.031471 28.568057 21.446105 2015
2016 25.151878 29.604317 22.597122 2016
2017 25.089634 29.418550 22.583788 2017
2018 23.396825 28.056689 20.692744 2018
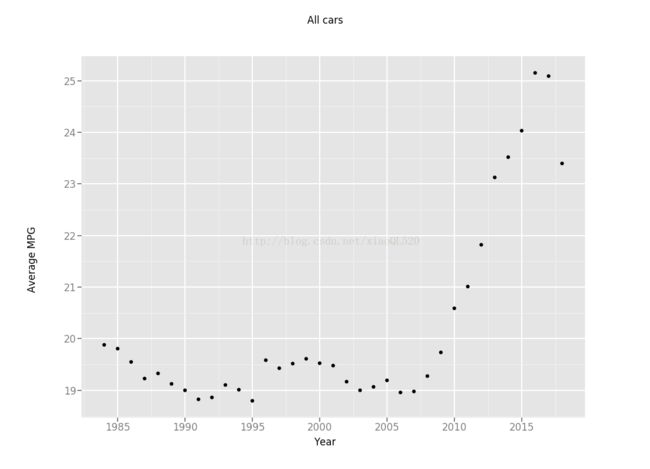
#- 使用ggplot包将结果绘成散点图
allCarPlt = ggplot(averaged, aes('year', 'comb08_mean')) + geom_point(colour='steelblue') + xlab("Year") + ylab("Average MPG") + ggtitle("All cars")
print(allCarPlt)

#- 去除混合动力汽车
criteria1 = vehicles.fuelType1.isin(['Regular Gasoline', 'Premium Gasoline', 'Midgrade Gasoline'])
criteria2 = vehicles.fuelType2.isnull()
criteria3 = vehicles.atvType != 'Hybrid'
vehicles_non_hybrid = vehicles[criteria1 & criteria2 & criteria3]
#print(vehicles_non_hybrid)
#- 将得到的数据框data frame按年份分组,并计算平均油耗
grouped = vehicles_non_hybrid.groupby(['year'])
averaged = grouped['comb08'].agg([np.mean])
averaged['hahhahah'] = averaged.index
print(averaged)
mean hahhahah
year
1984 19.121622 1984
1985 19.394686 1985
1986 19.320457 1986
1987 19.164568 1987
1988 19.367607 1988
1989 19.141964 1989
1990 19.031459 1990
1991 18.838060 1991
1992 18.861566 1992
1993 19.137383 1993
1994 19.092632 1994
1995 18.872591 1995
1996 19.530962 1996
1997 19.368000 1997
1998 19.329545 1998
1999 19.239759 1999
2000 19.169345 2000
2001 19.075058 2001
2002 18.950270 2002
2003 18.761711 2003
2004 18.967339 2004
2005 19.005510 2005
2006 18.786398 2006
2007 18.987512 2007
2008 19.191781 2008
2009 19.738095 2009
2010 20.466736 2010
2011 20.838219 2011
2012 21.407328 2012
2013 22.228877 2013
2014 22.279835 2014
2015 22.418539 2015
2016 22.742509 2016
2017 22.817854 2017
2018 22.911504 2018
#- 查看是否大引擎的汽车越来越少
print(pd.unique(vehicles_non_hybrid.displ))
[ 2. 4.9 2.2 5.2 1.8 1.6 2.3 2.8 4. 5. 3.3 3.1 3.8 4.6 3.4
3. 5.9 2.5 4.5 6.8 2.4 2.9 5.7 4.3 3.5 5.8 3.2 4.2 1.9 2.6
7.4 3.9 1.5 1.3 4.1 8. 6. 3.6 5.4 5.6 1. 2.1 1.2 6.5 2.7
4.7 5.5 1.1 5.3 4.4 3.7 6.7 4.8 1.7 6.2 8.3 1.4 6.1 7. 8.4
6.3 nan 6.6 6.4 0.9]
#- 去掉nan值,并用astype方法保证各个值都是float型的
criteria = vehicles_non_hybrid.displ.notnull()
vehicles_non_hybrid = vehicles_non_hybrid[criteria]
vehicles_non_hybrid.loc[:,'displ'] = vehicles_non_hybrid.displ.astype('float')
criteria = vehicles_non_hybrid.comb08.notnull()
vehicles_non_hybrid = vehicles_non_hybrid[criteria]
vehicles_non_hybrid.loc[:,'comb08'] = vehicles_non_hybrid.comb08.astype('float')
#- 最后用ggplot包来绘图
gasOnlineCarsPlt =  ggplot(vehicles_non_hybrid, aes('displ', 'comb08')) + geom_point(color='steelblue') +xlab('Engine Displacement') + ylab('Average MPG') + ggtitle('Gasoline cars')
print(gasOnlineCarsPlt)

#- 查看是否平均起来汽车越来越少了
grouped_by_year = vehicles_non_hybrid.groupby(['year'])
avg_grouped_by_year = grouped_by_year['displ', 'comb08'].agg([np.mean])
#- 计算displ和conm08的均值,并改造数据框data frame
avg_grouped_by_year['year'] = avg_grouped_by_year.index
melted_avg_grouped_by_year = pd.melt(avg_grouped_by_year, id_vars='year')
#- 创建分屏绘图
p = ggplot(aes(x='year', y='value', color = 'variable_0'), data=melted_avg_grouped_by_year)
p + geom_point() + facet_grid("variable_0",scales="free") #scales参数fixed表示固定坐标轴刻度,free表示反馈坐标轴刻度
print(p)

调查汽车的制造商和型号
#- 首先查看cylinders变量有哪些可能的值
print(pd.unique(vehicles_non_hybrid.cylinders))
[ 4. 12. 8. 6. 5. 10. 2. 3. 16. nan]
#- 再将cylinders变量转换为float类型,这样可以轻松方便地找到data frame的子集
vehicles_non_hybrid.cylinders = vehicles_non_hybrid.cylinders.astype('float')
pd.unique(vehicles_non_hybrid.cylinders)
#- 现在,我们可以查看各个时间段有四缸引擎汽车的品牌数量
vehicles_non_hybrid_4 = vehicles_non_hybrid[(vehicles_non_hybrid.cylinders==4.0)]

grouped_by_year_4_cylinder =vehicles_non_hybrid_4.groupby(['year']).make.nunique()
#fig = grouped_by_year_4_cylinder.plot()
plt.plot(grouped_by_year_4_cylinder)
plt.xlabel("Year")
plt.ylabel("Number of 4-Cylinder Maker")
plt.show()
分析:
我们可以从上图中看到,从1985年以来四缸引擎汽车的品牌数量呈下降趋势。然而,需要注意的是,这张图可能会造成误导,因为我们并不知道汽车品牌总数是否在同期也发生了变化。为了一探究竟,我们继续一下操作。
# -  查看各年有四缸引擎汽车的品牌的列表,找出每年的品牌列表
grouped_by_year_4_cylinder = vehicles_non_hybrid_4.groupby(['year'])
unique_makes = []
from functools import reduce
for name, group in grouped_by_year_4_cylinder:
    # list中存入set(),set里包含每年中的不同品牌
    unique_makes.append(set(pd.unique(group['make'])))
unique_makes = reduce(set.intersection, unique_makes)
print(unique_makes)
{'Nissan', 'Toyota', 'Chevrolet', 'Honda', 'Mazda', 'Volkswagen', 'Dodge', 'Subaru', 'Ford', 'Jeep'}
由上可知:在此期间只有10家制造商每年都制造四缸引擎汽车。
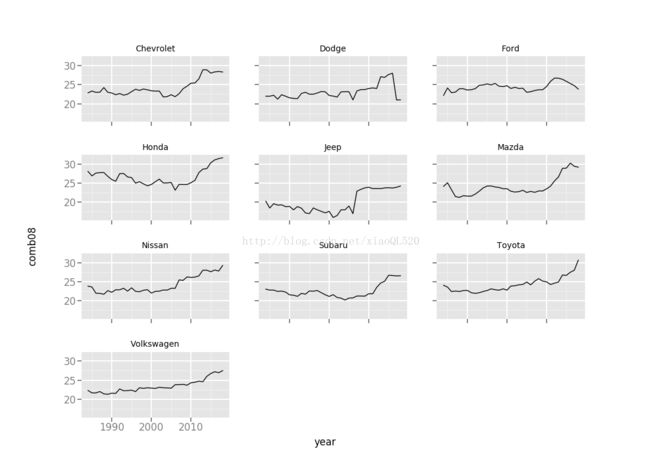
接下来,我们去发现这些汽车生产商的型号随时间的油耗表现。
#创建一个空列表,最终用来产生布尔值Booleans
boolean_mask = []
#用iterrows生成器generator遍历data frame中的各行来产生每行及索引
for index, row in vehicles_non_hybrid_4.iterrows():
    #判断每行的品牌是否在此前计算的unique_makes集合中,在将此布尔值Blooeans添加在Booleans_mask集合后面
    make = row['make']
    boolean_mask.append(make in unique_makes)
df_common_makes = vehicles_non_hybrid_4[boolean_mask]

#-  先将数据框data frame按year和make分组,然后计算各组的均值
df_common_makes_grouped = df_common_makes.groupby(['year', 'make']).agg(np.mean).reset_index()
#-  最后利用ggplot提供的分屏图来显示结果
oilWithTime = ggplot(aes(x='year', y='comb08'), data = df_common_makes_grouped) + geom_line() + facet_wrap('make')
print(oilWithTime)

