Covid19:传染病模型模拟Agent based simulation for SIR/SEIR models
Content
- Scale-free Network Simulation
- Simulation for SIR model
- Codes for SIR simulation
- Simulation for SIR model
- Codes for SEIR simulation
- Reference
github地址
Scale-free Network Simulation
Simulation for SIR model
We conduct network simulation using Netlogo and construct a scale-free network using Netlogo extension nw.Here, we use a simulation with 2000 agents as an example.
We conduct an experiment to explore the range of the outcome if we put the parameters we pop in to a range. This is called parameter sensitivity test.
Here, we test the following parameters in the form of [minimum, step, maximum] in the model which run 500 times with 2000 agents and check the tick every 50 ticks.
| parameters | ranges |
|---|---|
| initial-outbreak-size | [1 1 5] |
| recovery-rate | [1 10 100] |
| virus-spread-rate | [1 10 100] |
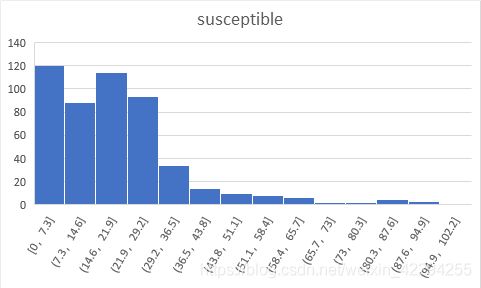
By running the model multiple times, we could get the average result of 500 time series data and calculate the minimum, maximum and mean results of the ratio of susceptible people, the ratio of infected people, the ratio of recovered people.
The simulation result show that the ratio of the three types of people follows power law distruibution which is exatly the property of the scale-free network.
| average(%) | min | max | mean |
|---|---|---|---|
| susceptible | 9.9720 | 97.0000 | 19.7972 |
| infected | 1.5560 | 78.2940 | 44.6495 |
| recovered | 0.0000 | 53.4540 | 35.5533 |
| virus | 1.5560 | 78.2940 | 44.6495 |
 |
 |
|---|

Codes for SIR simulation
extensions [ nw ]
;;; Extended model of AVI model for social propagation issues
;;; Concepts: Agent, virus, interaction, role, environment, social network
;;;

turtles-own           ;; properties of agents;;
[
 infected?           ;; if true, the agent is infectious, role feature
 resistant?          ;; if true, the agent can't be infected, role feature
 virus-recovered-period   ;; number of ticks since this agent's last virus check, i.e., the minimum recovered period of agents
 virus?              ;; whether the agent carry the H1N1 virus
]


to setup
 clear-all
 setup-agents        ;; setup of agents
 setup-environment   ;; setup of environment
 degree-distribution-plot  ;; chart plot setup
 virus-status-plot   ;; chart plot setup
 virus-initialization
 reset-ticks
end

to virus-initialization
   ask n-of initial-outbreak-size turtles
   [ play-infected ]
end

to  setup-environment ;; environment setup, comprised of grids.
 ask patches
   [ set pcolor white ]
end

to setup-agents       ;; agents setup;;
 set-default-shape turtles "person"
 nw:generate-preferential-attachment turtles links 100  [
   ;; Make agents not too close to each others.
   setxy (random-xcor * 0.95) (random-ycor * 0.95)
   set color green
   play-susceptible
   set virus-recovered-period random virus-check-frequency
   ]

end


to go
 if all? turtles [not infected?]
   [ stop ]
 ask turtles
 [
    set virus-recovered-period virus-recovered-period + 1
    if virus-recovered-period >= virus-check-frequency
      [ set virus-recovered-period 0 ]
 ]
 tick
 interaction-between-agents
 do-virus-checks
 degree-distribution-plot
 virus-status-plot

end


to interaction-between-agents   ;; Interaction;interactions between agents, especially between the infected agents and the susceptiple agents

 ask turtles with [infected?]
   [
     if count my-links > 0
     [
     ask one-of link-neighbors
       [
         ;; interaction
        if not resistant?
            [ play-infected ]
        ]
     ]
   ]
end


to do-virus-checks
 ask turtles with [infected? and virus-recovered-period = 0]
 [
   if random 100 < recovery-rate
   [
     ifelse random 100 < recovery-rate
   [play-resistent]
   [play-susceptible]
   ]
 ]
end


to play-infected    ;; agent plays the infected role
 set infected? true
 set resistant? false
 set virus? true
 set color red
end

to play-susceptible ;; agent plays the susceptible role
 set infected? false
 set resistant? false
  set virus? false
 set color green
end

to play-resistent  ;; agent plays the recovered role
 set infected? false
 set resistant? true
 set virus? false
 set color gray
 ask my-links [ set color gray - 2 ]
end


to degree-distribution-plot
  set-current-plot "Degree-distribution"
 set-current-plot-pen "agent-percentage"
 clear-plot
 let max-degree 1
 ask max-one-of turtles [count my-links]
 [
   set max-degree count my-links
 ]
  let current_plot_degree 0
 repeat max-degree + 1
 [
   plotxy current_plot_degree    ( count turtles with [ (count my-links) = current_plot_degree ]/ (count turtles) ) * 100
   set current_plot_degree  current_plot_degree + 1
 ]
end


to virus-status-plot                    ;;; the chart for the status of H1N1 virus spread in the artificial society
 set-current-plot "covid19-spread Status"
 set-current-plot-pen "susceptible"
 plot (count turtles with [not infected? and not resistant? ]) / (count turtles) * 100
 set-current-plot-pen "infected"
 plot (count turtles with [infected?]) / (count turtles) * 100
 set-current-plot-pen "resistant"
 plot (count turtles with [resistant?]) / (count turtles) * 100
 ;set-current-plot-pen "covid19 virus"        ;;; This shows how many agents carry H1N1 virus
 ;plot (count turtles with [virus?]) / (count turtles) * 100
end

Simulation for SIR model
We conduct an experiment to explore the range of the outcome if we put the parameters we pop in to a range. This is called parameter sensitivity test.
Here, we test the following parameters in the form of [minimum, step, maximum] in the model which run 500 times with 2000 agents and check the tick every 50 ticks.
| parameters | ranges |
|---|---|
| initial-outbreak-size | [1 1 5] |
| recovery-rate | [1 10 100] |
| incubation-rate | [1 10 100] |
| virus-spread-rate | [1 10 100] |
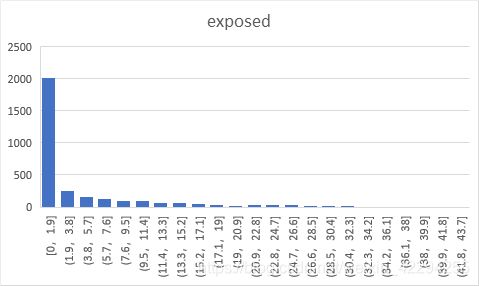
By running the model multiple times, we could get the average result of 500 time series data and calculate the minimum, maximum and mean results of the ratio of susceptible people, the ratio of exposed people, the ratio of infected people, the ratio of recovered people, and the ratio of the virus remaining in the system.
The simulation result show that the ratio of the four types of people follows power law distruibution which is exatly the property of the scale-free network.
| average(%) | min | max | mean |
|---|---|---|---|
| susceptible | 32.3918 | 97.8309 | 43.9674 |
| exposed | 0.0000 | 14.3373 | 5.7009 |
| infected | 1.2026 | 41.5529 | 21.8660 |
| recovered | 0.0000 | 46.8978 | 28.4640 |
| virus | 1.3938 | 48.6874 | 27.5569 |
 |
 |
|---|---|
 |
 |
Codes for SEIR simulation
extensions [ nw ]
;;; Extended model of AVI model for social propagation issues
;;; Concepts: Agent, virus, interaction, role, environment, social network
;;;

turtles-own           ;; properties of agents;;
[
  infected?           ;; if true, the agent is infectious, role feature
  resistant?          ;; if true, the agent can't be infected, role feature
  exposed?            ;; if true, the agent is exposed, role feature
  recovered?          ;; if true, the agent is recovered, role feature
  virus-recovered-period   ;; number of ticks since this agent's last virus check, i.e., the minimum recovered period of agents
  virus?              ;; whether the agent carry the H1N1 virus
]


to setup
  __clear-all-and-reset-ticks
  setup-agents        ;; setup of agents
  setup-environment   ;; setup of environment
  degree-distribution-plot  ;; chart plot setup
  virus-status-plot   ;; chart plot setup
  virus-initialization
end

to virus-initialization
    ask n-of initial-outbreak-size turtles
    [ play-infected ]
end

to  setup-environment ;; environment setup, comprised of grids.
  ask patches
    [ set pcolor white ]
end

to setup-agents       ;; agents setup;;
  set-default-shape turtles "person"
  nw:generate-preferential-attachment turtles links 100  [
    ;; Make agents not too close to each others.
    setxy (random-xcor * 0.95) (random-ycor * 0.95)
    set color green
    play-susceptible
    set virus-recovered-period random virus-check-frequency
    ]

end

;how  does the JGN social network danymically grow?
;construct the network


to go
 if ( ticks > simulation-num )
   [stop]
  ask turtles
  [
     set virus-recovered-period virus-recovered-period + 1
     if virus-recovered-period >= virus-check-frequency
       [ set virus-recovered-period 0 ]
  ]
  interaction-between-agents
  tick
  do-virus-checks
  degree-distribution-plot
  virus-status-plot
end


to interaction-between-agents   ;; Interaction;interactions between agents, especially between the infected agents and the susceptiple agents

  ask turtles with [infected?]
    [
      if count my-links > 0
      [
      ask one-of link-neighbors
        [
          ;; interaction
          if not recovered? and random-float 100 < incubation-rate
            [ play-exposed ]
         ]
      ]
    ]
end


to do-virus-checks
  ask turtles with [infected? and virus-recovered-period = 0]
  [
    if random 100 < recovery-rate
    [
         play-recovered
    ]
  ]
  ask turtles with [exposed?]
    [
    if random-float 100 < virus-spread-rate
    [play-infected]
  ]
end

to play-exposed      ;; agent plays the exposed role
  set infected? false
  set exposed? true
  set recovered? false
  set virus? true
  set virus-recovered-period random  virus-check-frequency
  set color blue
end


to play-infected    ;; agent plays the infected role
  set infected? true
  set exposed? false
  set recovered? false
  set virus? true
  set color red
end

to play-susceptible ;; agent plays the susceptible role
  set infected? false
  set exposed? false
  set recovered? false
   set virus? false
  set color green
end

to play-recovered  ;; agent plays the recovered role
  set infected? false
  set exposed? false
  set recovered? true
  set virus? false
  set color gray
  ask my-links [ set color gray - 2 ]
end


to degree-distribution-plot
   set-current-plot "Degree-distribution"
  set-current-plot-pen "agent-percentage"
  clear-plot
  let max-degree 1
  ask max-one-of turtles [count my-links]
  [
    set max-degree count my-links
  ]
   let current_plot_degree 0
  repeat max-degree + 1
  [
    plotxy current_plot_degree    ( count turtles with [ (count my-links) = current_plot_degree ]/ (count turtles) ) * 100
    set current_plot_degree  current_plot_degree + 1
  ]
end


to virus-status-plot                    ;;; the chart for the status of H1N1 virus spread in the artificial society
  set-current-plot "covid19-spread Status"
  set-current-plot-pen "susceptible"
  plot (count turtles with [not infected? and not recovered? and not exposed?]) / (count turtles) * 100
  set-current-plot-pen "infected"
  plot (count turtles with [infected?]) / (count turtles) * 100
  set-current-plot-pen "recovered"
  plot (count turtles with [recovered?]) / (count turtles) * 100
  set-current-plot-pen "exposed"
  plot (count turtles with [exposed?])/(count turtles) * 100
 ; set-current-plot-pen "covid19 virus"        ;;; This shows how many agents carry H1N1 virus
  ;plot (count turtles with [virus?]) / (count turtles) * 100
end

Reference
.
Stonedahl, F. and Wilensky, U. (2008). NetLogo Virus on a Network model.
Center for Connected Learning and Computer-Based Modeling, Northwestern University, Evanston, IL.Wilensky, U. (1999). NetLogo.
Center for Connected Learning and Computer-Based Modeling, Northwestern University, Evanston, IL.
欢迎关注二幺子的知识输出通道: