Tensorflow波士顿房价预测学习记录
Tensorflow波士顿房价预测学习记录
第一.导入需要的库
import numpy as np
import matplotlib.pyplot as plt
import tensorflow as tf
numpy数组用来初始化(后文)
matplotlib用来画图,可以更加明显的突出数据的变化
第二.加载波士顿地价
介绍
波士顿房价数据集是统计的20世纪70年代中期波士顿郊区房价的中位数,统计了当时教区部分的犯罪率、房产税等共计13个指标,统计出房价,试图能找到那些指标与房价的关系。本例子明显的是属于回归模型的案例。在数据集中包含506组数据,其中404是训练样本,剩下的102组数据作为验证样本。
也就说房价和13个因素有关,这次只研究一个因素
boston_housing=tf.keras.datasets.boston_housing
(train_x,train_y),(test_x,test_y)=boston_housing.load_data()
# 加载波士顿训练集,测试集
第三.测试集,集训练集的加载
x_train=train_x[:,5]
y_train=train_y
#训练集
#取出房间数和房价
#房价可以和原始数据区分

x_test=test_x[:,5]
y_test=test_y
#测试集房间数房价同理
第四.超参数 ——学习率 循环次数 每次展示间隔
learn_rate=0.04
iter=2000
display_step=200
第五.设置模型参数初始值
np.random.seed(612)
w=tf.Variable(np.random.randn())
b=tf.Variable(np.random.randn())
# w.numpy()  b.numpy()
# float32    float32
mse_train=[]#训练误差
mse_test=[]#测试误差
笔记:
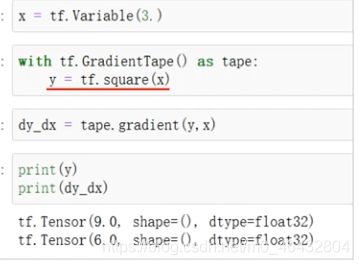
Tensorflow有自动求导机制–GrandientTape
其具有上下文管理器,监视with语句块中所有的变量和计算过程,并把他们记录在梯度袋中

(函数:被求导的函数 自变量:求导参数)
例如:

对多个参数求偏导时,
法一:将多个参数设成一个列表传入
![]()
法二:

persistent使用方法下边会讲
当二阶求导时
注意:
函数中的persistent参数为布尔类型,默认false只能用一次,多次使用 用如下方法: 另一个参数
另一个参数
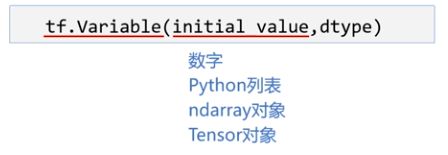
Variable对象
- 对tensor进一步封装
- 在模型训练中自动记录梯度,实现算法优化
- 可以被训练(默认:dtpye=int32/float32)

- 张量也可以变为可训练变量
tf.Variable(tf.constant([1,2],[3,4])) - 也可以赋值
x=tf.Variable([1,2])
对可训练变量修改
第六.建立模型并规定输出
for i in range(0,iter+1):
    with tf.GradientTape() as tape:
        #训练集上的预测值和均方误差
        pred_train=w*x_train+b
        loss_train=0.5*tf.reduce_mean(tf.square(y_train-pred_train))
        #测试集上的预测值和均方误差
        pred_test=w*x_test+b
        loss_test=0.5*tf.reduce_mean(tf.square(y_test-pred_test))

    #放进梯度袋中,对w和b监视

    mse_test.append(loss_test)
    mse_train.append(loss_train)

    #误差记录

    dl_dw,dl_db=tape.gradient(loss_train,[w,b])# 训练集的数计算梯度
    w.assign_sub(learn_rate*dl_dw)
    b.assign_sub(learn_rate*dl_db)# 使用梯度更新

    if i % display_step == 0:
        print("1:%i   train loss:%f   test_loss:%f"%(i,loss_train,loss_test))
第七.画图
plt.figure(figsize=(150,150))

plt.subplot(221)
plt.scatter(x_train,y_train,color="blue",label="data")
plt.plot(x_train,pred_train,color='red',label='model')
plt.legend(loc='upper right')

plt.subplot(222)
plt.plot(mse_train,color='blue',linewidth=3,label='train_loss')
plt.plot(mse_test,color='red',linewidth=1.5,label='test losss')
plt.legend(loc='upper left')

plt.subplot(223)
plt.plot(y_train,color='blue',marker='o',label='true_price')
plt.plot(pred_train,color='red',marker='.',label='predict')
plt.legend()

plt.subplot(224)
plt.plot(y_test,color='blue',marker='o',label='true_price')
plt.plot(pred_test,color='red',marker='.',label='predict')
plt.legend()

plt.show()
 matplotlib.pyplot结合题目的学习笔记学习笔记
重复的不赘述
- 第一张 红线训练得到的线性模型 蓝点房间数散点图 scatter散点图 plot直线
- 第二张 损失值随迭代次数的变化图
- 第三张 训练集实际房价和预测房价对比 404条
- 第四张 测试集实际房价和预测房价对比 102条
学习来源https://www.icourse163.org/course/XUST-1206363802


