Echarts 饼状图的标注 字体等样式修改
这里只演示字体的一个效果,举一反三其他样式也一样(参考官方文档)

这个看文档不就行了,但是,我在实际情况中根据文档并没有解决问题。
关于 饼状图 的样式,
根据文档中有两处写法:
seriesi.itemStyle.normal.label.textStyle(有效)
seriesi.markPoint.itemStyle.normal.label.textStyle(无效)
自行查看文档,说明都是:标签的文本样式。
点击直达>>>>Echarts2.0 参考文档
这里记录下实践的代码 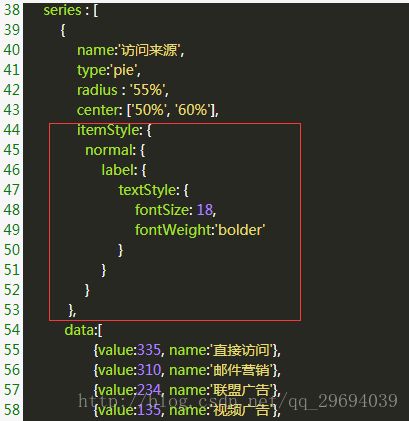
 - 要注意看图中的结构与位置,放在其他位置是不可以的!

itemStyle : {
    normal : {
        label : {
            show : false
        },
        labelLine : {
            show : false
        }
    },
    emphasis : {
        label : {
            show : true
        },
        labelLine : {
            show : true
        }
    }
},
var option = {
title : {
text : 'ECharts 入门示例'
},
tooltip : {},
toolbox: {
feature: {
magicType: {
show : true,
title : {
line : '动态类型切换-折线图',
bar : '动态类型切换-柱形图'
},
type : ['line', 'bar']
},
restore : {
show : true,
title : '还原',
color : 'black'
},
saveAsImage : {
show : true,
title : '保存为图片',
type : 'jpeg',
lang : ['点击本地保存']
}
}
},
legend : {
data : [ '销量' ]
},
xAxis : {
data : [ "衬衫", "羊毛衫", "雪纺衫", "裤子", "高跟鞋", "袜子" ]
},
yAxis : {},
series : [ {
name : '销量',
type : 'bar',
data : [ 5, 20, 36, 10, 10, 20 ]
} ]
};
var option1 = {
title : {
text : '南丁格尔玫瑰图',
subtext : '纯属虚构',
x : 'center'
},
tooltip : {
trigger : 'item',
formatter : "{a}
{b} : {c} ({d}%)"
},
legend : {
x : 'center',
y : 'bottom',
data : [ 'rose1', 'rose2', 'rose3', 'rose4', 'rose5', 'rose6', 'rose7', 'rose8' ]
},
toolbox : {
show : true,
feature : {
mark : {
show : true
},
dataView : {
show : true,
readOnly : false
},
magicType : {
show : true,
type : [ 'pie', 'funnel' ]
},
restore : {
show : true
},
saveAsImage : {
show : true
}
}
},
calculable : true,
series : [
{
name : '半径模式',
type : 'pie',
radius : [ 20, 110 ],
center : [ '25%', 200 ],
roseType : 'radius',
width : '40%', // for funnel
max : 40, // for funnel
itemStyle : {
normal : {
label : {
show : false
},
labelLine : {
show : false
}
},
emphasis : {
label : {
show : true
},
labelLine : {
show : true
}
}
},
data : [
{value : 0,name : 'rose1'},
{
value : 10,
name : 'rose2'
},
{
value : 20,
name : 'rose3'
},
{
value : 30,
name : 'rose4'
},
{
value : 0,
name : 'rose5'
},
{
value : 40,
name : 'rose6'
},
{
value : 50,
name : 'rose7'
},
{
value : 30,
name : 'rose8'
}
]
},
{
name : '面积模式',
type : 'pie',
radius : [ 30, 110 ],
center : [ '75%', 200 ],
roseType : 'area',
x : '50%', // for funnel
max : 40, // for funnel
sort : 'ascending', // for funnel
itemStyle: {
normal: {
label: {
textStyle: {
fontSize: 14,
fontWeight:'bolder'
}
}
}
},
data : [
{
value : 10,
name : 'rose1'
},
{
value : 5,
name : 'rose2'
},
{
value : 15,
name : 'rose3'
},
{
value : 25,
name : 'rose4'
},
{
value : 20,
name : 'rose5'
},
{
value : 35,
name : 'rose6'
},
{
value : 30,
name : 'rose7'
},
{
value : 40,
name : 'rose8'
}
]
}
]
};