2020第三届中青杯问题总结
文章目录
- 论文上
-
- 如何双栏排版?
- 公式换行对齐
- 怎么设置行距
- 编程
-
- Pandas 读取 Excel 文件的 Sheet
- 怎么生成一个2019年1月1日,到2020年3月26日的时间序列呢?
- DataFrame 左连接
- 如何将多个dataframe保存到同一个excel中的不同sheet里
- 用 Matlab 读取 Excel 表格
- 用Matlab找出 NaN 所在的行
- 剑荡八荒式画图(Python)
- Dickey-Fuller 检验
- df 怎么把第一列设置为索引
- df 按时间分组
- Python 画箱型图
- ValueError: Length of values does not match length of index
- 怎么创建特定长度的,值为 nan 的 array
- 剑荡八荒式画图——2
- 怎么把 df index 设置为第一列——2
这篇文章是写给我自己看的,里面有很多技巧,当然大家也可以学习一下。
论文上
我是一个人参赛,只靠自己。论文用的 Latex。
如何双栏排版?
在需要双栏排版的地方,加入如下语句:
\begin{multicols}{2}

\end{multicols}
公式换行对齐
需要对齐的长公式可以用split 环境,它本身不能单独使用,因此也称作次环境,必须包含在equation 或其它数学环境内。split 环境用 \ 和& 来分行和设置对齐位置。
\begin{equation}

\begin{split}

x=&a+b+c+\\
&d+e+f+g

\end{split}
\end{equation}
怎么设置行距
\renewcommand{\baselinestretch}{1.25}
编程
Pandas 读取 Excel 文件的 Sheet
X0 = pd.read_excel(r'../附件/附件:十支股票参数.xlsx',0)
X1 = pd.read_excel(r'../附件/附件:十支股票参数.xlsx',1)
X2 = pd.read_excel(r'../附件/附件:十支股票参数.xlsx',2)
。。。
X9 = pd.read_excel(r'../附件/附件:十支股票参数.xlsx',9)
怎么生成一个2019年1月1日,到2020年3月26日的时间序列呢?
(用于生成一个空表格,在填进去,然后找出缺失数据)定义一个类,再导入文件使用接口。
# -*- coding: utf-8 -*-
"""
Created on Fri May 29 21:07:59 2020

@author: Administrator
"""

import re
import calendar
import datetime


class FormatError(ValueError):
    pass


class Date(object):
    @classmethod
    def date_range(cls, start=None, end=None, periods=None, freq=None, input_format=None, out_format=None):
        """
        生成时间序列
        :param start: 序列开始时间
        :param end: 序列结束时间, 给定start时, 结束时间不包含end
        :param periods: int, 生成的时间序列长度
        :param freq: 要生成时间序列的时间间隔
        :param out_format: 是否输出格式化后的字符串, 若要输出可指定输出格式. "%Y-%m-%d %H:%M:%S"
        :param input_format: 若start或end是字符串且无法自动推断时间格式则需指定格式
        :return: [date or date_str]
        """
        start = cls.str_to_date(start, input_format)
        end = cls.str_to_date(end, input_format)
        out = []
        if start is None and end and periods:
            for i in range(periods-1):
                old, end = cls.date_replace(end, cls._freq(freq), mod="-")
                if i == 0:
                    out.append(old)
                out = [end] + out
        elif end is None and start and periods:
            for i in range(periods-1):
                old, start = cls.date_replace(start, cls._freq(freq), mod="+")
                if i == 0:
                    out.append(old)
                out.append(start)
        elif periods is None and start and end:
            i = 0
            while True:
                old, start = cls.date_replace(start, cls._freq(freq), mod="+")
                if i == 0:
                    out.append(old)
                    i += 1
                if start < end:
                    out.append(start)
                else:
                    break
        else:
            raise ValueError("start, end, periods 须且只能指定其中两个")
        if out_format is True:
            out = [str(i) for i in out]
        elif out_format is not None:
            out = [i.strftime(out_format) for i in out]
        return out

    @staticmethod
    def date_replace(date, freq=(0, )*6, mod="+"):
        timedelta = datetime.timedelta(days=freq[2], hours=freq[3], minutes=freq[4], seconds=freq[5])
        if mod == "+":
            if sum(freq[:2]) == 0:
                old = date
                date = date + timedelta
            elif sum(freq[2:]) == 0:
                y = date.year + freq[0] + (date.month + freq[1] - 1) // 12
                m = (date.month + freq[1] - 1) % 12 + 1
                old = date.replace(day=calendar.monthrange(date.year, date.month)[1])
                date = date.replace(year=y, month=m, day=calendar.monthrange(y, m)[1])
            else:
                raise ValueError(" '年月' 不能同时和 '日时分秒' 作为间隔")
        elif mod == "-":
            if sum(freq[:2]) == 0:
                old = date
                date = date - timedelta
            elif sum(freq[2:]) == 0:
                y = date.year - freq[0] + (date.month - freq[1] - 1) // 12
                m = (date.month - freq[1] - 1) % 12 + 1
                old = date.replace(day=calendar.monthrange(date.year, date.month)[1])
                date = date.replace(year=y, month=m, day=calendar.monthrange(y, m)[1])
            else:
                raise ValueError(" '年月' 不能同时和 '日时分秒' 作为间隔")
        else:
            raise ValueError("mod值只能是 '+' 或 '-' ")
        return old, date

    @staticmethod
    def _freq(freq=None):
        """
        设置时间间隔
        :param freq: "Y2m3d4H5M6S" 表示间隔 1年2月3日4时5分6秒
        :return: [年, 月, 日, 时, 分, 秒]
        """
        freq_ = [0] * 6
        if freq is None:
            freq_[2] = 1
            return freq_
        for n, i in enumerate(["Y", "m", "d", "H", "M", "S"]):
            r = f'((\d*){i})'
            s = re.search(r, freq)
            if s:
                freq_[n] = int(s.group(2)) if s.group(2) else 1
        return freq_

    @staticmethod
    def str_to_date(string, format_=None):
        """
        字符串转时间, 默认自动推断格式
        :param string: 时间字符串
        :param format_: 格式
        :return: 对应的时间类型, 输入非字符串则原值输出
        """
        if not isinstance(string, str):
            return string
        if format_:
            return datetime.datetime.strptime(string, format_)
        s = re.match(r'(\d{4})\D+(\d{1,2})\D+(\d{1,2})(?:\D+(\d{1,2}))?(?:\D+(\d{1,2}))?(?:\D+(\d{1,2}))?\D*$', string)
        if s:
            result = [int(i) for i in s.groups() if i]
            return datetime.datetime(*result)
        s = re.match(r'(\d{4})\D*(\d{2})\D*(\d{2})\D*(\d{2})?\D*(\d{2})?\D*(\d{2})?\D*$', string)
        if s:
            result = [int(i) for i in s.groups() if i]
            return datetime.datetime(*result)
        else:
            raise FormatError("自动推断失败, 请指定format_")
导入文件使用:
from Daterange import Date   #Daterange是我取的 py 文件名,下面是使用方法
print(Date.date_range(datetime.datetime(2018, 9, 18), periods=10))
print()
print(Date.date_range('20180918', '2018-09-28'))
print()
print(Date.date_range(end='20180927', periods=10))
print()
print(Date.date_range('20180918', '2018-09-28', out_format=True))
print()
print(Date.date_range('2018/09/18', '2018-09-28', out_format="%Y-%m-%d"))
print()
print(Date.date_range('2018年9月18日', '2019-09-28', freq="m", out_format="%Y-%m-%d"))
print()
print(Date.date_range('2018/9/18', '2018-9-19', freq="3H", out_format=True))
DataFrame 左连接
df1:
   co12 col1
0     1    a
1     2    b

df2:
   co13 col1
0    11    a
1    33    c

print pd.merge(left=df1, right=df2, how='inner', left_on='col1', right_on='col1')
----------
   co12 col1  co13
0     1    a    11

print pd.merge(left=df1, right=df2, how='left', left_on='col1', right_on='col1')
----------
   co12 col1  co13
0     1    a    11
1     2    b   NaN

print pd.merge(left=df1, right=df2, how='left', left_on='col1', right_on='col1')
----------
   co12 col1  co13
0     1    a    11
1   NaN    c    33
如何将多个dataframe保存到同一个excel中的不同sheet里
writer = pd.ExcelWriter('result.xlsx')
for i in X:
       i.to_excel(excel_writer=writer,sheet_name=i,index=False)
writer.save()
writer.close()
X为多个 dataframe 构成的 python 列表
用 Matlab 读取 Excel 表格
我想用 Matlab 里的 cftool 来填补缺失值。然后,只要将模型输出,就可以直接拿来使用。(点击 Save to workspace)

之后,只要在 workspace 里面,输出 y = fittedmodel2(x) 就可以了。
用Matlab找出 NaN 所在的行
[m n] = find(isnan(X))
剑荡八荒式画图(Python)
plt.rcParams['font.sans-serif']=['SimHei']    #画图时显示中文字体
plt.rcParams['axes.unicode_minus'] = False

for i, ax in enumerate(axes.flat):
    ax.hist(X[i].iloc[:,-1])
    ax.set_xlabel('柱状图',fontsize=14)
Dickey-Fuller 检验
它可以用于验证 时序数据是否稳定,具体可点击链接:https://www.docin.com/p-1628484711.html,用法如下:
from statsmodels.tsa.stattools import adfuller
result = adfuller(X[1].iloc[:,-1])
print('ADF Statistic: %f' % result[0])
print('p-value: %f' % result[1])
print('Critical Values:')
for key, value in result[4].items():
 	print('\t%s: %.3f' % (key, value))
df 怎么把第一列设置为索引
for i in range(10):
    X.append(pd.read_excel(r'../附件/填充后数据.xlsx',i,index_col = '时间'))
直接在读取的时候用index_col声明即可。
df 按时间分组
首先要把时间设置为索引,具体方法见上。之后,用 pandas 的 Grouper 模块即可,如下所示:
    tmp = X[i].iloc[:,-1]   # tmp 为 Series(主要是我要画箱子图)
    months
    groups = tmp.groupby(pd.Grouper(freq='30d'))    #groupby 接口
    for name,group in groups:    #groups 是一个乱七八糟的数据结构,我们要做的是遍历他,使之可用。 这里的 group 就是一个 Series 了。
        months[name.month] = group.values
    months.boxplot()
Python 画箱型图
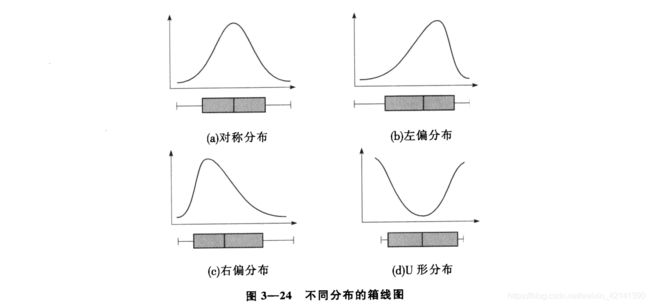
箱型图能够反映数据部分总体,或者局部的变化。如下所示

虽然能够用 Pandas 直接画出箱型图,但是却不能和 plt 联动,因此对于画多个箱型图来说,比较不方便。那么,如何用plt 来画箱型图呢?
plt.boxplot(x=df.values,labels=df.columns,whis=1.5)
plt.show()
ValueError: Length of values does not match length of index
fig, axes = plt.subplots(10,1, figsize=(8, 6),subplot_kw={
     'xticks':[], 'yticks':[]},
                        gridspec_kw=dict(hspace=0.05, wspace=0.1))
for i, ax in enumerate(axes.flat):
    tmp = X[i].iloc[:,-1]
    groups = tmp.groupby(pd.Grouper(freq='30d'))
    month = pd.DataFrame()
    for name,group in groups:
        try:
            month[str(name.year)+str(name.month)] = group.values   #这里由于有“剩余”,所以导致长度不匹配,故需要另外处理,如下:
        except:
            l = len(group.values)
            month[str(name.year)+str(name.month)] = np.nan   #先给他赋值为 nan,再用数据替代。
            month[str(name.year)+str(name.month)].iloc[0:l] = group.values

    ax.boxplot(x=month.values,labels=month.columns,whis=1.5)
    ax.set_xlabel('日期序列',fontsize=14)
怎么创建特定长度的,值为 nan 的 array
month[str(name.year)+str(name.month)] = np.array([np.nan]*31)
剑荡八荒式画图——2
fig = plt.figure(figsize=(9,12))
for i in range(10):
    ax = fig.add_subplot(10,1,i+1)
    tmp = X[i].iloc[:,-1]
    plot_acf(tmp,lags=30,ax=ax,title='')
怎么把 df index 设置为第一列——2
df.index = df.iloc[:,1]
