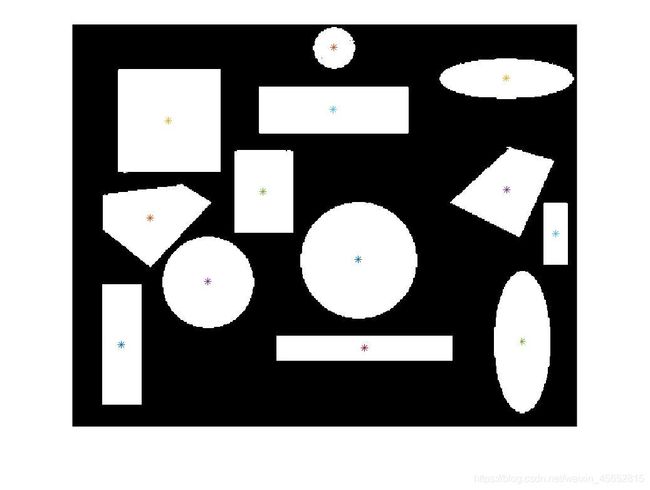
寻找连通域的质心
MATLAB
1、灰度化
2、二值化
3、取反
4、连通域标记
连通域标记
5、对每个连通域,计算x坐标和,y坐标和,分别除以面积则为质心坐标
clear;clc;close all;
I=imread('1.png');%读取原图像
figure(1);imshow(I);%显示原图像

I_gray=rgb2gray(I);%原图像变为灰度图像
level=graythresh(I_gray);%计算图像I_gray的全局阈值,level为标准化灰度值,其范围为[0 1]
[height,width]=size(I_gray);%计算灰度图像的长宽
I_bw=im2bw(I_gray,level);%im2bw使用阈值level将灰度图像转换为二值图像.
figure(2);imshow(I_bw);%显示二值图像(背景为白色)

for i=1:height %%循环中进行反色
    for j=1:width
        if I_bw(i,j)==1
            I_bw(i,j)=0;
        else I_bw(i,j)=1;
        end
    end
end
figure(3);imshow(I_bw);%显示取反后的二值图像(背景为黑色)

[L,num]=bwlabel(I_bw,8);%bwlabel标注二值图像I_bw中的目标物体,返回标识矩阵L和I_bw中目标物体的数量num,8表示连通数.
plot_x=zeros(1,num);%%zeros(m,n)产生m×n的全0矩阵.用于记录质心位置的横坐标
plot_y=zeros(1,num);%zeros(m,n)产生m×n的全0矩阵.用于记录质心位置的纵坐标

for k=1:num  %%num个区域依次统计质心位置
    sum_x=0;    sum_y=0;    area=0; %初始化
    for i=1:height
        for j=1:width
            if L(i,j)==k
                sum_x=sum_x+i;  %计算第K区域的横坐标总和
                sum_y=sum_y+j;  %计算第K区域的纵坐标总和
                area=area+1;    %计算第K区域的由多少个坐标点表示
            end
        end
    end
    plot_x(k)=fix(sum_x/area);  %计算第K区域的质心横坐标
    plot_y(k)=fix(sum_y/area);%计算第K区域的质心纵坐标
end

figure(4);imshow(I_bw);%显示取反后的二值图像(背景为黑色),并在图上标注质心点位置
for i=1:num
    hold  on
    plot(plot_y(i) ,plot_x(i), '*')
end

C++
1、灰度化
2、高斯滤波
3、canny算子边缘检测
4、寻找轮廓
5、寻找轮廓的矩,计算质心
5、画出轮廓,画出外接矩形以及质心
#include #coding=utf-8
import cv2
import numpy as np
img = cv2.imread('./image/multiple.png')
# convert the image to grayscale
gray_image = cv2.cvtColor(img, cv2.COLOR_BGR2GRAY)
# convert the grayscale image to binary image
ret,thresh = cv2.threshold(gray_image,127,255,0)
# find contour in the binary image
contours, hierarchy = cv2.findContours(thresh,cv2.RETR_TREE,cv2.CHAIN_APPROX_SIMPLE)
# find contour in the binary image(opencv4)
#binary, contours, opt = cv2.findContours(thresh,cv2.RETR_TREE,cv2.CHAIN_APPROX_SIMPLE)
for c in contours:
# calculate moments for each contour
M = cv2.moments(c)
cX = int(M["m10"] / M["m00"])
cY = int(M["m01"] / M["m00"])
# calculate x,y coordinate of center
cv2.circle(img, (cX, cY), 5, (255, 255, 255), -1)
cv2.putText(img, "centroid", (cX - 25, cY - 25),cv2.FONT_HERSHEY_SIMPLEX, 0.5, (255, 255, 255), 2)
# 3.4.1 im2, contours, hierarchy = cv.findContours(thresh, cv.RETR_TREE, cv.CHAIN_APPROX_SIMPLE)
# 3.2.0 im2, contours, hierarchy = cv2.findContours(thresh,cv2.RETR_TREE,cv2.CHAIN_APPROX_SIMPLE)
# display the image
cv2.imshow("Image", img)
cv2.waitKey(0)