使用python进行Linux服务器监测,画CPU使用率和内存占用图
整体思想
- 使用python包psutil 获取linux服务器CPU、内存等相关数据
- 数据保存在本地或者保存在数据库
- 读取数据,使用python包pyecharts画图
- 使用Flask,页面前端访问
一、pstuil 的安装和使用,保存数据
pip install pstuil
import psutil
import time
import MySQLdb as mysql

db = mysql.connect(user="test", passwd="123456", db="test", host="200.200.200.200")
db.autocommit(True)
cur = db.cursor()
def getinfo():
	mem = psutil.virtual_memory()
	memtotal = mem.total
	memfree = mem.free
	mempercent = mem.percent
	memused = mem.used
	cpu = psutil.cpu_percent(1)
	return memtotal,memfree,memused,mempercent,cpu

if __name__== "__main__":
	while True:
		try:
			memtotal,memfree,memused,mempercent,cpu =getinfo()
			t = int(time.time())
			sql = 'insert into stat (mem_free,mem_usage,mem_total,mempercent,cpu,time) value (%s,%s,%s,%s,%s,%s)'%(memfree,memused,memtotal,mempercent,cpu,t)
			cur.execute(sql)
			time.sleep(10)
		except Exception as e:
			print(e)
二、pyecharts画图
pyecharts github地址
中文文档地址
from matplotlib import pyplot as plt
import MySQLdb as mysql
from pyecharts import Line
con = mysql.connect(user="test", passwd="123456", db="test", host="200.200.200.200")
cur = con.cursor()
sql = 'select cpu from stat'
cur.execute(sql)
cpu_data = cur.fetchall()
all_cpu = []
for cpu in cpu_data:
cpu_num = eval(cpu[0])
all_cpu.append(cpu_num)
# 使用pyecharts画图
x = [i for i in range(32)]
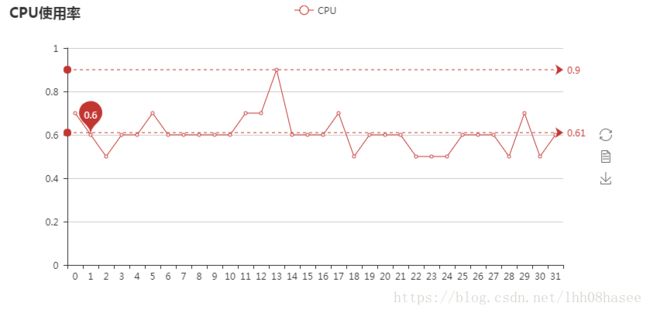
line = Line("CPU使用率")
line.add("CPU", x, all_cpu, mark_point=["average"], mark_line=["max", "average"])
line.render() # 在当前路径生成render.html,打开html可查看图
# 使用matplotlib画图
# plt.plot(all_cpu)
# plt.show()
con.close()
画出的图,右侧有下载图片功能。横坐标应该用时间,这里例子简单点。
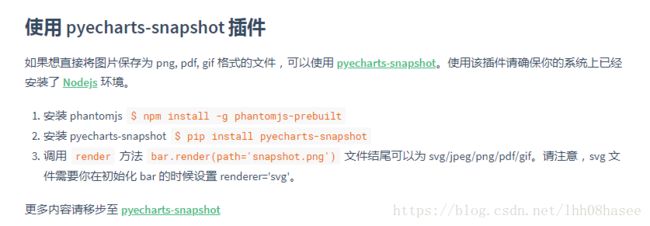
如果不想生成html文件,而是图片,需要另外安装插件,且要有Node.js环境。
三、Flask前端显示
#coding:utf-8

from flask import Flask, render_template
import MySQLdb as mysql
from pyecharts import Line
from datetime import datetime
import time

app = Flask(__name__)

DATAFORMAT = "%Y-%m-%d %H:%M:%S"
REMOTE_HOST = "https://pyecharts.github.io/assets/js"
CON = mysql.connect(user="test", passwd="123456", db="test", host="200.200.200.200")
CUR = CON.cursor()

@app.route("/")
def hello():
    s3d = cpu_line()
    return render_template(
        "pyecharts.html",
        myechart=s3d.render_embed(),
        host=REMOTE_HOST,
        script_list=s3d.get_js_dependencies(),
    )


@app.route("/mem")
def mem():
    s2d = mem_line()
    return render_template(
        "pyecharts.html",
        myechart=s2d.render_embed(),
        host=REMOTE_HOST,
        script_list=s2d.get_js_dependencies(),
    )


def mem_line():
    sql = 'SELECT mem,time FROM serverinfo'
    CUR.execute(sql)
    mem_data = CUR.fetchall()
    all_mem = []
    mem_time = []
    for mem in mem_data:
        mem_num = eval(mem[0])
        mem_date = eval(mem[1])
        all_mem.append(mem_num)
        time_local = time.localtime(mem_date)
        dt = time.strftime("%Y-%m-%d %H:%M:%S", time_local)
        mem_time.append(dt)
    line = Line("MEM使用率")
    line.add("MEM", mem_time, all_mem)
    return line


def cpu_line():
    sql = 'select cpu from stat'
    CUR.execute(sql)
    cpu_data = CUR.fetchall()
    all_cpu = []
    for cpu in cpu_data:
        cpu_num = eval(cpu[0])
        all_cpu.append(cpu_num)
    x = [i for i in range(32)]
    line = Line("CPU使用率")
    line.add("CPU", x, all_cpu, mark_point=["average"], mark_line=["max", "average"])
    return line


if __name__ == '__main__':
    app.run(host='127.0.0.1', port=5000, debug=True)