R语言基础编程技巧汇编 - 19
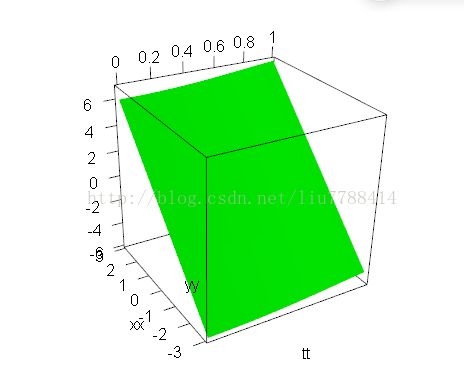
1. 用rgl包绘制复杂函数图像
画出函数y=sin(t^2)+2*x的图像,可以假设t的取值范围为[0,1],x的取值范围为[-3,3]。
library(rgl);
tt = seq(0, 1, length.out = 200);
xx = seq(-3, 3, length.out = 200);
yy = outer(tt, xx, function(tt, xx)sin(tt^2) + 2 * xx);
persp3d(tt, xx, yy, col ="green");
1. 查看对象占用的内存
sort(sapply(ls(),function(x){object.size(get(x))}))
1. 绘制非等距离的坐标轴
par(cex=0.7)
x<-c(0,2,4,8,16,32,64,128,256,512)
y <-matrix(c(900,900,900,900,900,900,900,900,900,900,1950,1950,1940,1930,1960,1940,1910,1900,1860,1820,2780,2700,2580,2400,2360,2200,2000,1900,1870,1860),ncol=3)
#y是十行3列随即生成的矩阵
plot(x,y[,1],xlim=range(0,512),ylim=range(800,2800),xlab=x,ylab="",axes=TRUE, col="black",xaxt='n') # <--你要关闭plot默认创建的横轴
#y 打印第一条线
box(col="black")#设置边框颜色
lines(x, y[,1], col="black")
points(x, y[,1])
#显示第一个线的点
lines(x, y[,2], col="black")
#在当前的面板上打印第二条线
points(x, y[,2], pch=2)
#显示第二条线的点,并设置点的形状为三角形,pch是设置形状。
lines(x, y[,3], col="black")
points(x, y[,3], pch=3)
mtext("", side=3, line=0.5)
legend(80,2800,c("","",""),pch=c(1,2,3))
axis(1,at=c(0,2,4,8,16,32,64,128,256,512))# <--这里是关键

4. CentOS 6.3 64bit, R不支持 PNG图片显示问题解决
R版本:3.0.1, OS:CentOS 6.3 64bit
做图时发现采用PNG输出图片时出错:
$ R
> png(file="kmeans.png",bg="transparent")
错误于.External2(C_X11,paste("png::", filename, sep = ""), g$width, :
无法打开PNG设备
此外:警告信息:
In png(file = "kmeans.png", bg ="transparent") :本R版本不支持png
> # 检查R是否支持PNG等图形显示:
> capabilities()
jpeg png tiff tcltk X11 aqua http/ftp sockets
FALSE FALSE FALSE TRUE TRUE FALSE TRUE TRUE
libxml fifo cledit iconv NLS profmem cairo
TRUE TRUE TRUE TRUE TRUE FALSE FALSE
首先,退出R,然后安装一堆相关的包
$ sudo yum install libpng libpng-devellibtiff libtiff-devel libjpeg-turbo libjpeg-turbo-devel
然后重新build R,请根据自己的包修改 R_VERSION
$ tar -xf %R_VERSION%.tar.gz
$ cd %R_VERSION%
$ ./configure --enable-R-shlib--with-libpng --with-jpeglib --with-libtiff --with-x
$ make clean
$ make
$ sudo make install
重新进入R,再次检查
$ R
> capabilities()
jpeg png tiff tcltk X11 aqua http/ftp sockets
TRUE TRUE TRUE TRUE TRUE FALSE TRUE TRUE
libxml fifo cledit iconv NLS profmem cairo
TRUE TRUE TRUE TRUE TRUE FALSE FALSE
5. 部分base包函数的标题翻译
.Device Lists of Open/Active Graphics Devices
打开/激活的图形设备的列表
.Internal Call an Internal Function
调用一个内部函数
.Last.value Value ofLast Evaluated Expression
上一个计算的表达式的值
.Library Search Paths for Packages
程序包所在的文件夹的位置
.Machine Numerical Characteristics of the Machine
计算能表示的数字的范围等
.Platform Platform Specific Variables
正在使用的系统平台的一些变量
.Primitive Calla "Primitive" Internal Function
调用系统原始的内部函数,可以获得较好的执行效率
.Script Scripting Language Interface
其它脚本语言(如Perl Python等)的执行接口
.deparseOpts Options forExpression Deparsing
deparse, dput和 dump函数的表达式的选项
.onLoad Hooks for Name Space events
与命名空间事件相关的
.packages Listing of Packages
列出已安装包的列表
.standard_regexps Miscellaneous Internal/Programming Utilities
各种内部的或程序的功能
: Colon Operator 冒号操作符
:: Double Colon and Triple Colon Operators
双冒号和三冒号操作符
<- Assignment Operators赋值操作符
@ Extract Slots 提取属性
Arithmetic Arithmetic Operators算术操作符+- * / ^ %% %/%
AsIs Inhibit Interpretation/Conversion of Objects
限制对象被自动转换或诠释
Bessel Bessel Functions Bessel函数
Comparison Relational Operators关系操作符
Control Control Flow 程序执行流程控制
Cstack_info Report Information on C Stack Size and Usage
报告内存中C堆栈的可用大小和已使用了的大小
DateTimeClasses Date-Time Classes时期时间类
Dates Date Class 日期类
Defunct Marking Objects as Defunct移除对象
Deprecated Marking Objects as Deprecated移除对象
Encoding Read or Set the Declared Encodings for a
CharacterVector
读取或设置字符向量的编码
Extract Extract or Replace Parts of an Object
抽取或替换对象的某一部分
Filter Common Higher-Order Functions in Functional
Programming Languages
从一个向量中抽取出符合条件的元素
Foreign Foreign Function Interface
其它语言的函数接口
InternalMethods Internal Generic Functions
内部泛型函数
LETTERS Built-in Constants
内部常量除LETTERS外还有letters,month.abb,month.name和pi
Logic Logical Operators
逻辑操作符
Memory Memory Available for Data Storage
管理R用来存储数据的内存
Memory-limits MemoryLimits in R
R中的内存限制,可以用memory.limit()和memory.size查看内存使用情况
NA Not Available / "Missing" Values
缺失值
NULL The Null Object
空值
NotYetImplemented Not YetImplemented Functions and Unused
Arguments
找出没有被使用的函数和变量,这是R开发小组为解决兼容性问题而使用的函数.
NumericConstants NumericConstants
数值常数
Ops.Date Operators on the Date Class
日期运算符
Paren Parentheses and Braces
大括号和圆括号,(你知道{3+3;4+4}的结果吗?)
Quotes Quotes
引号
R.Version Version Information
查看R的版本
R.home Return the R Home Directory
返回R的安装目录
RNG Random Number Generation
产生随机数和指定随机数的种子
6. 绘制R语言中所有的颜色
#输出文件保存在C:/R_color.png
png(file="C:/R_color.png",width=1500,height=650)
a.c <- colors()
op1 <- par(mar=c(0,0,0,0))
plot(1:100,1:100,pch="")
colN <- 48
cex.l <- 0.9
mof.x <- 7.7
for(i in 1:ceiling(length(a.c)/colN)){
idx.star <- 1+colN*(i-1)
idx.end <- ifelse(colN*i < length(a.c),colN*i,length(a.c))
legend(-3+(i-1)*mof.x,103,fill=a.c[idx.star:idx.end],a.c[idx.star:idx.end],cex=cex.l,bty="n")
}
dev.off()

7. 利用filter函数求移动平均
filter函数可以生成连续子序列,比如可以由(a,b,c,d,e,f),生成(a,b,c),(b,c,d),(c,d,e),(d,e,f)这样的子序列
moving.averages <- function(x, step = 3)
{
#Check data type of x
if(!is.numeric(x))
{
stop("x must be a vector of numbers.")
}
#Check length of x
if(length(x) < step)
{
stop("Thelength of x must be greater than the step!")
}
#Get the sums for each step
moving.sum.x <- filter(x,rep(1,step))
#Compute the average for each step
moving.average.x <- moving.sum.x/step
#Get the index of NA
NA.index <- which(is.na(moving.average.x))
#Remove NA
moving.average.x <- moving.average.x[-NA.index]
}
x <- c(1,2,3,4,5,6,5,4,3,2,1)
MA <- moving.averages(x)
MA
8. Windows系统下访问数据库
如果用ODBC访问的话:
1.安装对应数据库的ODBC驱动
2.在windows ODBC数据源管理里定义DSN
3.安装R的RODBC package
4.在你的R code里library(RODBC)
5.dc<-odbcConnect('your_odbc_dsn')
6.sqlQuery(dc,'select * from your_table')
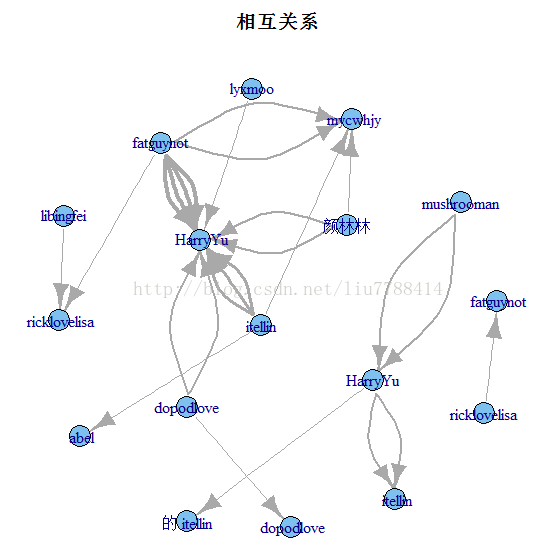
9. igraph包的一种应用示例
找出一个论坛的跟帖者和回复者之间的关系。
第一步:扒数据
因为只需要跟帖者和回复者的信息,因此只需要提取帖子中的作者和帖子两个信息。
library(rvest)
library(stringr)
topic = function(i) {
url = str_c("http://cos.name/cn/topic/147357/page/",i,"/")
author = url %>% html() %>%html_nodes(".bbp-author-name") %>%
html_text() %>% .[-1]%>% as.vector
conut = url %>% html() %>%html_nodes(".bbp-reply-content") %>% length
content = url %>% html() %>%html_nodes(".bbp-reply-content") %>%
.[c(-1,-conut)] %>%html_text() %>% as.vector
data.frame(author = author,content = content)
}
topic.list = lapply(1:7,topic)
dat = do.call(rbind,topic.list)
第二步:找出回复者。
x = str_extract(dat[[2]],"回复.*:")
reply = substr(x,10,str_locate(x,":")[,1] - 1)
dat$reply = reply
dat = dat[c(1,3)]
dat = na.omit(dat)
> dat
author reply
2 mushrooman HarryYu
5 mushrooman HarryYu
13 itellin HarryYu
15 dopodlove HarryYu
16 dopodlove dopodlove
18 dopodlove HarryYu
22 itellin HarryYu
26 itellin HarryYu
27 HarryYu itellin
28 HarryYu itellin
32 itellin abel
42 颜林林 mycwhjy
48 itellin mycwhjy
51 fatguynot mycwhjy
52 ricklovelisa fatguynot
54 fatguynot ricklovelisa
55 fatguynot HarryYu
56 fatguynot HarryYu
65 libingfei ricklovelisa
69 fatguynot HarryYu
70 fatguynot mycwhjy
77 fatguynot HarryYu
86 颜林林 HarryYu
88 颜林林 HarryYu
90 lyxmoo HarryYu
第三步:可视化
library(igraph)
relation.network = graph.edgelist(as.matrix(dat),directed = T)
E(relation.network)$weight =count.multiple(relation.network)
relation.network.weighted =simplify(relation.network,remove.multiple = T,remove.loops = T,edge.attr.comb ='mean')
l =layout.fruchterman.reingold(relation.network, niter=5000,area=vcount(relation.network)^4*10)
plot(relation.network,layout=l,
edge.arrow.size=0.5,
edge.width = E(relation.network)$weight,
vertex.shape="circle",
vertex.size=10,
main = "相互关系")
10. 使用na.omit函数排除NA值
NAs <- c(NA,NA,1,2,3,4,5)
as.vector(na.omit(NAs))
[1] 1 2 3 4 5
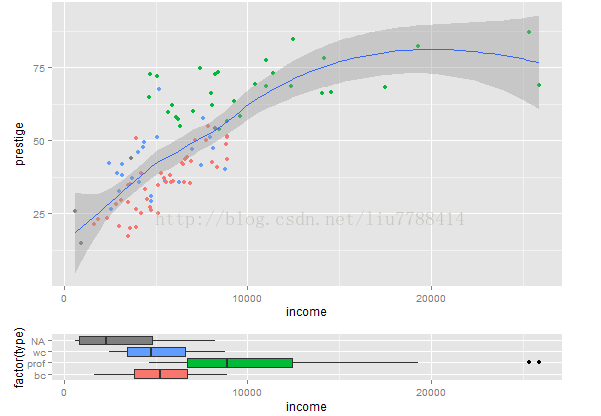
11. 绘制带有边缘盒图的散点图
library(car) # where data Prestige is
library(ggplot2)
library(gtable)
# scatter plot
p1 <- ggplot() +
geom_point(data = Prestige, aes(income, prestige, colour =factor(type))) +
geom_smooth(data = Prestige, aes(income, prestige), method ="loess") +
guides(colour = FALSE) +
#scale_x_continuous(expand = c(0, 0)) +
#scale_y_continuous(expand = c(0, 0)) +
theme(plot.margin = unit(c(0.2, 0.2, 0.5, 0.5), "lines"))
# Horizontal marginal boxplot - to appearat the bottom of the chart
p2 <- ggplot(Prestige, aes(x =factor(type), y = income, fill = factor(type))) +
geom_boxplot() +
#scale_y_continuous(expand = c(0, 0)) +
coord_flip() +
guides(fill = FALSE)+
theme(plot.margin = unit(c(0.2, 0.2, 0.5, 0.5), "lines"))
gt1 <- ggplot_gtable(ggplot_build(p1))
gt2 <- ggplot_gtable(ggplot_build(p2))
# Get maximum widths
maxWidth <- unit.pmax(gt1$widths[2:3],gt2$widths[2:3])
# Set the maximums in the gtables for gt1and gt2
gt1$widths[2:3] <- as.list(maxWidth)
gt2$widths[2:3] <- as.list(maxWidth)
# Create a new gtable
gt <- gtable(widths = unit(c(7, 1),"null"), height = unit(c(7, 2), "null"))
# Instert gt1 and gt2 into the new gtable
gt <- gtable_add_grob(gt, gt1, 1, 1)
gt <- gtable_add_grob(gt, gt2, 2, 1)
# And render the plot
grid.newpage()
grid.draw(gt)
12. 显示bmp图片
本例中分别以全色和黑白色模式来显示bmp图片,图片可以自己任意选择。
library(bmp)
library(pixmap)
r=read.bmp('myrgbimage.bmp')
pr=pixmapRGB(r)
plot(pr)
r=read.bmp('mygreyimage.bmp')
pr=pixmapGrey(r)
plot(pr)
13. 利用正则表达式辅助读取数据
需要读取的数据格式如下:
pm25 pm10 co no2 031 o38 so2 time
86 112 1 31 41 36 74 2014/1/20 18:26
86 112 1 31 41 36 74 2014/1/20 18:58
86 112 1 31 41 36 74 2014/1/20 19:30
106 137 2 30 13 17 127 2014/1/20 20:04
100 129 2 32 15 14 122 2014/1/20 20:36
86 112 1 31 41 36 74 2014/1/21 21:08
86 112 1 31 41 36 74 2014/1/21 21:40
136 173 3 48 10 15 0 2014/1/21 22:12
136 173 3 48 10 15 0 2014/1/21 22:44
>DF<-read.table(textConnection(sub("(2014/.*$)","'\\1'",readLines(con="clipboard"))),header=TRUE,stringsAsFactors = FALSE)
> DF$time
[1] "2014/1/20 18:26""2014/1/20 18:58" "2014/1/20 19:30"
[4] "2014/1/20 20:04""2014/1/20 20:36" "2014/1/21 21:08"
[7] "2014/1/21 21:40""2014/1/21 22:12" "2014/1/21 22:44"
如果不用正则表达式,则time列不能正常读取,因为有空格.
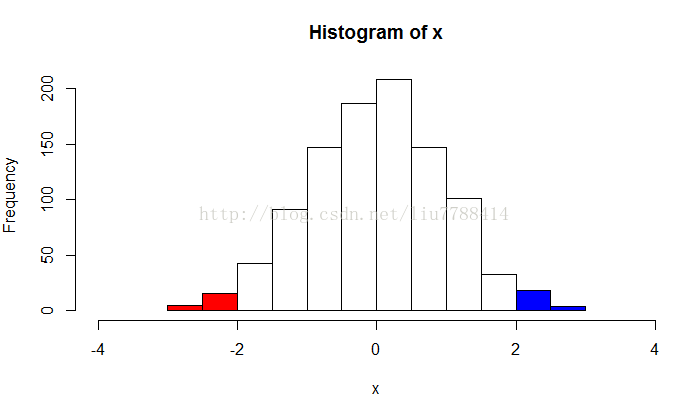
14. 利用clip函数在同一幅图中设置裁剪区域绘制多图
x <- rnorm(1000)
hist(x, xlim=c(-4,4))
usr <- par("usr")
clip(usr[1], -2, usr[3], usr[4])
hist(x, col = 'red', add = TRUE)
clip(2, usr[2], usr[3], usr[4])
hist(x, col = 'blue', add = TRUE)
do.call("clip",as.list(usr)) # reset to plot region
15. 生成eps格式图片
library(showtext)
setEPS()
postscript("cn.eps")
showtext.begin()
plot(rnorm(100), main="中文", family ="wqy")
showtext.end()
dev.off()