一、分布数据可视化 - 直方图与密度图
displot() / kdeplot()/ rugplot()
加载模块,设置风格,尺度
import numpy as np
import pandas as pd
import matplotlib.pyplot as plt
import seaborn as sns

#设置风格,尺度
sns.set_style('darkgrid')
sns.set_context('paper')

#不发出警告
import warnings
warnings.filterwarnings('ignore')
1.直方图 - distplot()
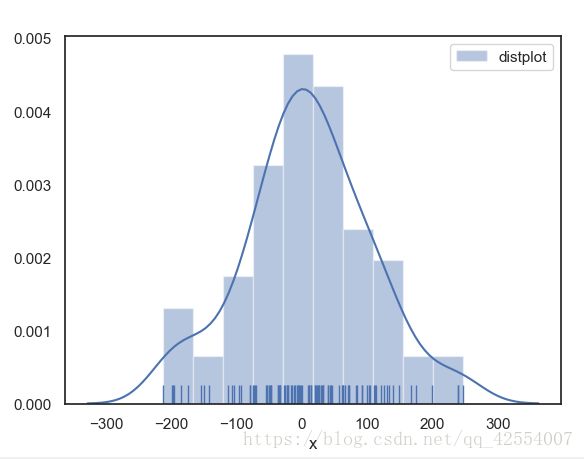
示例1:
rs = np.random.RandomState(10) #设定随机数种子
s = pd.Series(rs.randn(100) * 100)
sns.distplot(s, bins = 10, hist = True, kde = True, norm_hist = False,
            rug = True, vertical = True,
            color = 'b', label = 'distplot', axlabel = 'x')
plt.legend()
#bins ---> 箱数
#hist、ked ---> 是否显示箱/密度曲线
#norm_hist ---> 直方图是否按照密度来显示
#rug ---> 是否显示数据分布情况
#vertical ---> 是否水平显示
#color ---> 设置颜色
#label ---> 图例
#axlabel ---> x轴标注

图1. 直方图
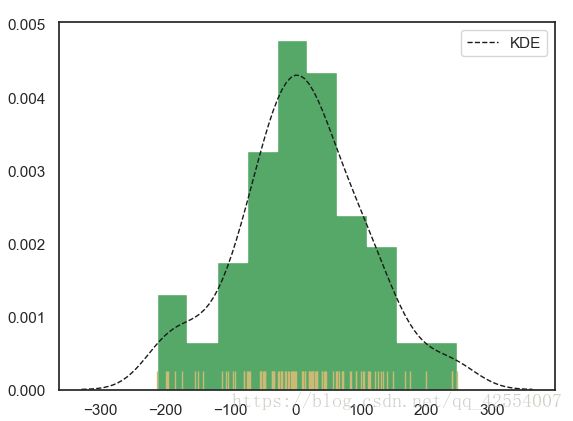
示例2:
sns.distplot(s, rug = True,
             rug_kws = {'color':'y'},
             #设置数据频率分布颜色
             kde_kws = {'color':'k', 'lw':1, 'label':'KDE', 'linestyle':'--'},
             #设置密度曲线颜色、线宽、标注、 线形
             hist_kws = {'histtype':'stepfilled', 'linewidth':1, 'alpha':1, 'color':'g'})
             # 设置箱子的风格、线宽、透明度、颜色
             # 风格包括:'bar'、'barstacked'、'step'、'stepfilled'

图2. 直方图
2.密度图 - kdeplot()
2.1 单个样本数据密度分布图
sns.kdeplot(s,
            shade = False, #是否填充
            color = 'r', #设置颜色
            vertical = False) #设置是否水平)

sns.kdeplot(s, bw = 1, label = 'bw : 0.2',
            linestyle = '--', linewidth = 1.2, alpha = 0.5)
sns.kdeplot(s, bw =20, label = 'bw : 2',
            linestyle = '--', linewidth = 1.2, alpha = 0.5)
#bw --> 控制拟合的程度,类似直方图的箱数
#数据频率分布
sns.rugplot(s, height = 0.1, color = 'r', alpha = 0.5)

图3. 单个样本数据密度分布图
2.2 两个样本的数据密度分布图
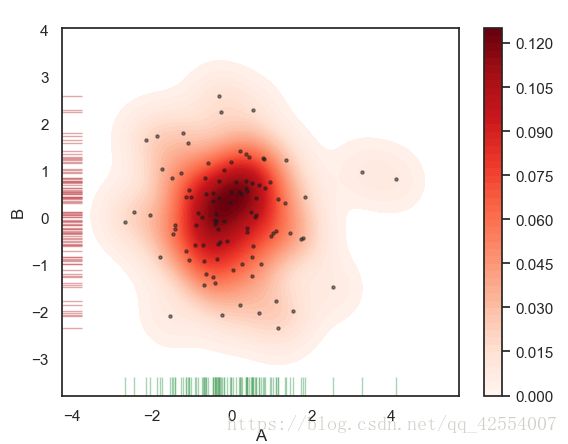
rs = np.random.RandomState(2) #设定随机数种子
df = pd.DataFrame(rs.randn(100,2),
                  columns = ['A', 'B'])

#两个维度数据生成曲线密度图,以颜色作为密度的衰减显示
sns.kdeplot(df['A'],df['B'],
            cbar = True,          #是否显示颜色的图例
            shade = True,         #是否填充
            cmap = 'Reds',        #设置调色盘
            shade_lowest = False, #最外围颜色是否显示
            n_levels = 50         #曲线个数(如果非常多,则会越平滑)
            )

#注意设置x,y轴
plt.scatter(df['A'],df['B'],s = 5, alpha = 0.5, color = 'k')
sns.rugplot(df['A'], color = 'g', axis = 'x', alpha = 0.5)
sns.rugplot(df['B'], color = 'r', axis = 'y', alpha = 0.5)

图4. 两个样本数据的密度分布图
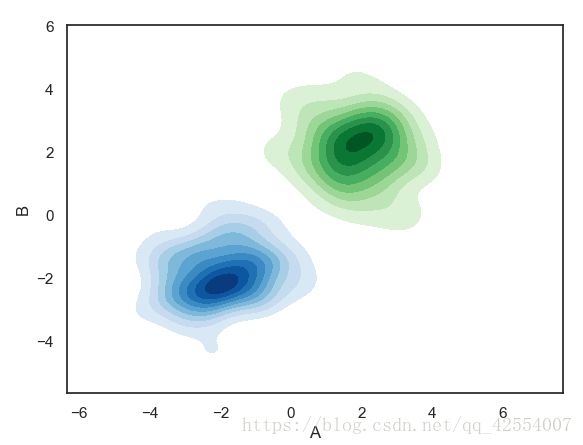
2.3 多个样本的密度图
#多个密度图
#创建数据
rs1 = np.random.RandomState(2)
rs2 = np.random.RandomState(5)
df1 = pd.DataFrame(rs1.randn(100,2)+2, columns = ['A','B'])
df2 = pd.DataFrame(rs2.randn(100,2)-2, columns = ['A','B'])
#创建图表
sns.kdeplot(df1['A'],df1['B'],cmap = 'Greens',
            shade = True, shade_lowest = False)
sns.kdeplot(df2['A'],df2['B'],cmap = 'Blues',
            shade = True, shade_lowest = False)

3.rugplot()
这个函数就是显示数据分布情况,具体使用参见上面代码


