opencv 图像增强_一文带你体验OpenCV强大图像处理功能
前言
计算机视觉基础首先是处理图像、视频这些非结构化的数据,
而图像处理库比较常用和强大的有 PIL、OpenCV 模块,
本项目主要讲述 OpenCV 的具体用法
内容目录
主要介绍了opencv模块在图像处理方面的一些常用操作。
* 图像文件操作
* 图像基本操作
* 绘图功能
* 轨迹栏做调色板
* 图像阈值
* 图像平滑
* 边缘检测
* 轮廓检测
* 颜色空间转换及目标追踪
* 图像增强
PS:需要本文项目的完整代码以及数据集的朋友,关注,在评论区私信小编即可分享给你,希望对读者朋友有所帮助!
pip install -i https://pypi.tuna.tsinghua.edu.cn/simple opencv-pythonRequirement already satisfied: opencv-python in /opt/conda/lib/python3.6/site-packages
Requirement already satisfied: numpy>=1.11.3 in /opt/conda/lib/python3.6/site-packages (from opencv-python)
导入模块
import cv2import numpy as npimport pandas as pdimport warningsimport seaborn as snsimport matplotlib.pyplot as pltwarnings.filterwarnings('ignore')%matplotlib inlineMatplotlib is building the font cache using fc-list. This may take a moment.
# 定义图像路径
path = '../work/CV/tx3.jpg'path2 = '../work/CV/cap.jpg'图像文件操作
### 1.读取图像
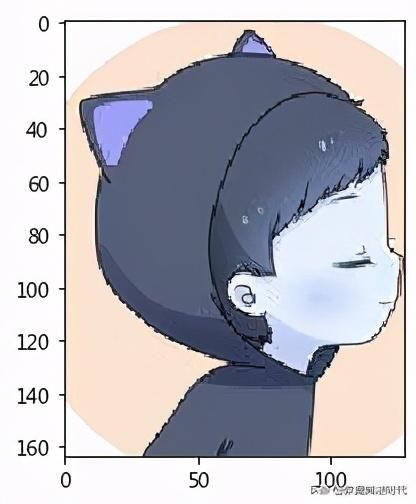
im = cv2.imread(path)# print(im)im = cv2.imread(path)# print(im)### 2.显示图像
cv2.imwrite('testSave_1.jpg', im)### 3.保存图像
cv2.imwrite('testSave_1.jpg', im)True
图像基本操作
### 1.图像属性查看
im.shape 返回(行数、列数、通道数)
im.size 返回像素总值 = 行数 x 列数 x 通道数
im.dtype 返回类型
print(">>>图像维度:", im.shape)print(">>>图像像素总数:", im.size)print(">>>图像数据类型:", im.dtype)>>>图像维度: (200, 200, 3)
>>>图像像素总数: 120000
>>>图像数据类型: uint8
### 2.截取ROI(感兴趣)区域
# 一般都是rgb,opencv默认是bgr# 分割b, g, r = cv2.split(im)b, g, r3.通道分割合并及像素直方图分析
#### 3.1.分割与合并
# 一般都是rgb,opencv默认是bgr# 分割b, g, r = cv2.split(im)b, g, r(array([[255, 255, 255, ..., 255, 255, 255],
[255, 255, 255, ..., 255, 255, 255],
[255, 255, 255, ..., 255, 255, 255],
...,
[255, 255, 255, ..., 255, 255, 255],
[255, 255, 255, ..., 255, 255, 255],
[255, 255, 255, ..., 255, 255, 255]], dtype=uint8),
array([[255, 255, 255, ..., 255, 255, 255],
[255, 255, 255, ..., 255, 255, 255],
[255, 255, 255, ..., 255, 255, 255],
...,
[255, 255, 255, ..., 255, 255, 255],
[255, 255, 255, ..., 255, 255, 255],
[255, 255, 255, ..., 255, 255, 255]], dtype=uint8),
array([[255, 255, 255, ..., 255, 255, 255],
[255, 255, 255, ..., 255, 255, 255],
[255, 255, 255, ..., 255, 255, 255],
...,
[255, 255, 255, ..., 255, 255, 255],
[255, 255, 255, ..., 255, 255, 255],
[255, 255, 255, ..., 255, 255, 255]], dtype=uint8))
# 合并im = cv2.merge((b, g, r))imarray([[[255, 255, 255],
[255, 255, 255],
[255, 255, 255],
...,
[255, 255, 255],
[255, 255, 255],
[255, 255, 255]],
[[255, 255, 255],
[255, 255, 255],
[255, 255, 255],
...,
[255, 255, 255],
[255, 255, 255],
[255, 255, 255]],
[[255, 255, 255],
[255, 255, 255],
[255, 255, 255],
...,
[255, 255, 255],
[255, 255, 255],
[255, 255, 255]],
...,
[[255, 255, 255],
[255, 255, 255],
[255, 255, 255],
...,
[255, 255, 255],
[255, 255, 255],
[255, 255, 255]],
[[255, 255, 255],
[255, 255, 255],
[255, 255, 255],
...,
[255, 255, 255],
[255, 255, 255],
[255, 255, 255]],
[[255, 255, 255],
[255, 255, 255],
[255, 255, 255],
...,
[255, 255, 255],
[255, 255, 255],
[255, 255, 255]]], dtype=uint8)
#### 3.2.像素直方图分析
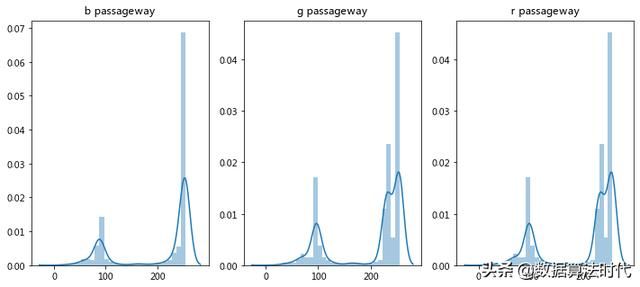
像素直方图分析可以观察像素分布情况,对观察与去除噪声有很大帮助。
bb = b.flatten() # 二维展平为一维gg = g.reshape(1, -1) # 二维展平为一维rr = g.reshape(1, -1) # 二维展平为一维imim = im.flatten()# 单一通道直方图统计plt.figure(figsize=(12, 5))plt.subplot(1,3,1)plt.title("b passageway")sns.distplot(bb)plt.subplot(1,3,2)plt.title("g passageway")sns.distplot(gg)plt.subplot(1,3,3)plt.title("r passageway")sns.distplot(rr)# 三个通道直方图统计
plt.title("bgr passageway")
sns.distplot(imim)
绘图功能
### 1.画线
cv2.line()画线
@params1: im 图像
@params2: 线的起始坐标 (0,10)
@params3: 线的终点坐标 (30,40)
@params4: 线的颜色(R,G,B)
@params5: 线的厚度
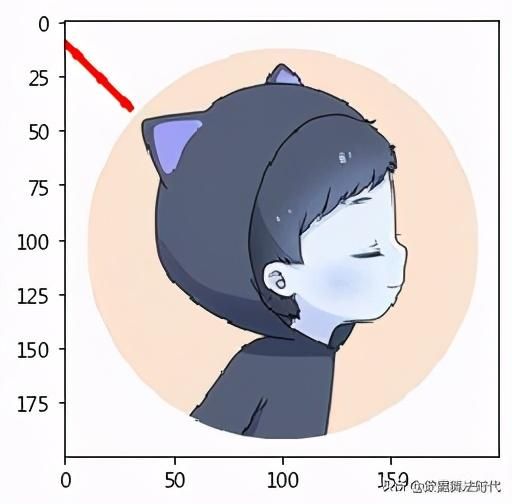
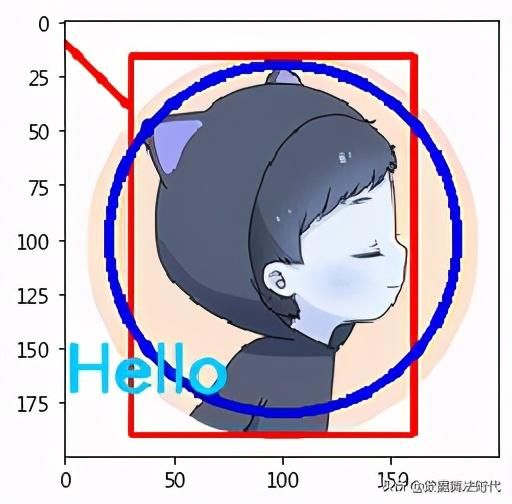
imline = cv2.line(im, (0,10), (30,40), (255,0,0), 2)plt.imshow(imline)### 2.画矩形
"""cv2.rectangle()画矩形@params1: im 图像@params2: 左上角坐标 (30,16)@params3: 右下角坐标 (160,190)@params4: 线的颜色(R,G,B)@params5: 线的厚度"""imline = cv2.rectangle(im, (30,16), (160,190), (255,0,0), 2)plt.imshow(imline)### 3.画圆圈
"""cv2.circle()画圆圈@params1: im 图像@params2: 圆的中心坐标 (100,100)@params3: 圆的半径 80@params4: 线的颜色(R,G,B)@params5: 线的厚度 -1(实心)"""imcircle = cv2.circle(im, (100,100), 80, (0,0,200), 3)plt.imshow(imline)### 4.在图像中添加文本
"""cv2.putText()在图片上写文本内容@params1: im 图像@params2: 文本内容@params3: 文本内容的起始坐标@params4: 字体@params5: 字体大小@params6: 字体颜色@params7: 字体厚度@params8: 字体的线型"""font = cv2.FONT_HERSHEY_SIMPLEXimputText = cv2.putText(im, 'Hello', (0,170), font, 1, (0,200,255), 2, cv2.LINE_AA)plt.imshow(imputText)轨迹栏作为调色板
"""您有一个显示颜色的窗口,以及三个用于指定B、G、R颜色的跟踪栏。滑动轨迹栏,并相应地更改窗口颜色。默认情况下,初始颜色将设置为黑色。cv2.createTrackbar()创建轨迹栏@params1: 轨迹栏名称;@params2: 窗口名称;@params3: 调色板起始值或默认值0;@params4: 调色板最大值;@params5: 执行回调函数每次跟踪栏值的更改。cv2.getTrackbarPos()移动调节轨迹栏@params1: 轨迹栏名称;@params2: 窗口名称;"""# import numpy as np# import cv2 as cv# def nothing(x):# pass# # 创建一个黑色的图像,一个窗口# img = np.zeros((300,512,3), np.uint8)# cv.namedWindow('image')# # 创建颜色变化的轨迹栏# cv.createTrackbar('R','image',0,255,nothing)# cv.createTrackbar('G','image',0,255,nothing)# cv.createTrackbar('B','image',0,255,nothing)# # 为 ON/OFF 功能创建开关# switch = '0 : OFF 1 : ON'# cv.createTrackbar(switch, 'image',0,1,nothing)# while(1):# cv.imshow('image',img)# k = cv.waitKey(1) & 0xFF# if k == 27:# break# # 得到四条轨迹的当前位置# r = cv.getTrackbarPos('R','image')# g = cv.getTrackbarPos('G','image')# b = cv.getTrackbarPos('B','image')# s = cv.getTrackbarPos(switch,'image')# if s == 0:# img[:] = 0# else:# img[:] = [b,g,r]# cv.destroyAllWindows()'您有一个显示颜色的窗口,以及三个用于指定B、G、R颜色的跟踪栏。滑动轨迹栏,并相应地更改窗口颜色。默认情况下,初始颜色将设置为黑色。cv2.createTrackbar()创建轨迹栏@params1: 轨迹栏名称;@params2: 窗口名称;@params3: 调色板起始值或默认值0;@params4: 调色板最大值;@params5: 执行回调函数每次跟踪栏值的更改。cv2.getTrackbarPos()移动调节轨迹栏@params1: 轨迹栏名称;@params2: 窗口名称;'
图像阈值
学习两个函数:cv.threshold()、cv.adaptiveThreshold()
"""cv2.threshold()图像阈值@params1:原图像;@params2:阈值,用于二值化分类;@params3:分配大于阈值的像素点的最大值;@params4:阈值类型。"""img = cv2.imread(path)ret, threshold1 = cv2.threshold(img, 100, 205, cv2.THRESH_BINARY)ret, threshold2 = cv2.threshold(img, 100, 205, cv2.THRESH_BINARY_INV)ret, threshold3 = cv2.threshold(img, 100, 205, cv2.THRESH_TRUNC)ret, threshold4 = cv2.threshold(img, 100, 205, cv2.THRESH_TOZERO)ret, threshold5 = cv2.threshold(img, 100, 205, cv2.THRESH_TOZERO_INV)titles = ['Original Image', 'BINARY', 'BINARY_INV', 'TRUNC', 'TOZERO', 'TOZERO_INV']imgs = [img, threshold1, threshold2, threshold3, threshold4, threshold5]for i in range(6): plt.subplot(2,3,i+1) plt.imshow(imgs[i], cmap='gray') plt.title(titles[i]) plt.xticks([]),plt.yticks([])图像平滑
### 1.2D卷积过滤
"""cv2.filter2D(im, -1, (1, 1))@params1:原始图像@params2:-1@params3:卷积内核大小"""conv2d_1 = cv2.filter2D(im, -1, (1, 1))kernel = np.ones((5, 5)) / 25conv2d_2 = cv2.filter2D(im, -1, kernel)plt.clf()plt.figure(figsize=(12, 5))plt.subplot(1,3,1)plt.title("origin")plt.imshow(im)plt.subplot(1,3,2)plt.title("conv2d_1")plt.imshow(conv2d_1)plt.subplot(1,3,3)plt.title("conv2d_2")plt.imshow(conv2d_2)### 2.图像模糊
"""cv2.blur(im, (3,3)) 将图像与归一化滤镜进行卷积完成滤波cv2.GaussianBlur(im, (5, 5), 0) 高斯滤波,0 是指根据窗口大小来计算高斯函数标准差median = cv2.medianBlur(im, 5) 中位滤波bf = cv2.bilateralFilter(im, 9, 75, 75) 双边滤波"""blur = cv2.blur(im, (3,3)) # 平均gaussian = cv2.GaussianBlur(im, (5, 5), 0)median = cv2.medianBlur(im, 5)bf = cv2.bilateralFilter(im, 9, 75, 75)plt.clf()plt.figure(figsize=(12, 5))plt.subplot(1,4,1)plt.title("blur")plt.imshow(blur)plt.subplot(1,4,2)plt.title("GaussianBlur")plt.imshow(gaussian)plt.subplot(1,4,3)plt.title("medianBlur")plt.imshow(median)plt.subplot(1,4,4)plt.title("bilateralFilter")plt.imshow(bf)## 边缘检测
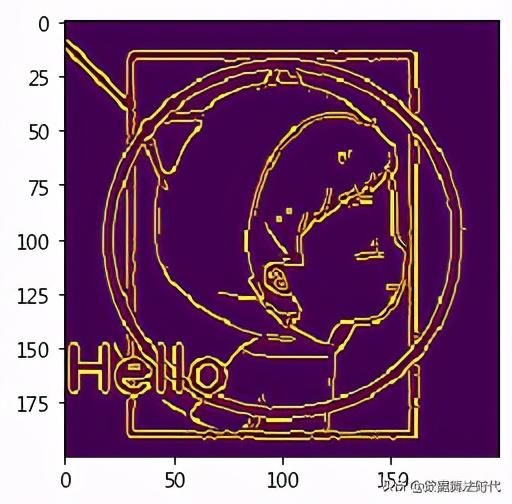
"""cv2.Canny(im, 100, 200, 3)@params1:原始图像;@params2:最小像素值;@params3:最大像素值;@params4:查找图像渐变内核大小。"""edges = cv2.Canny(im, 100, 200, 3)plt.imshow(edges)轮廓检测
### 1.寻找及绘制轮廓
"""cv2.findContours() @params1: 寻找轮廓的图像; @params2: 表示轮廓的检索模式,有四种(本文介绍的都是新的cv2接口): cv2.RETR_EXTERNAL表示只检测外轮廓 cv2.RETR_LIST检测的轮廓不建立等级关系 cv2.RETR_CCOMP建立两个等级的轮廓,上面的一层为外边界,里面的一层为内孔的边界信息。如果内孔内还有一个连通物体,这个物体的边界也在顶层。 cv2.RETR_TREE建立一个等级树结构的轮廓。 @params3: 轮廓的近似办法 cv2.CHAIN_APPROX_NONE存储所有的轮廓点,相邻的两个点的像素位置差不超过1,即max(abs(x1-x2),abs(y2-y1))==1 cv2.CHAIN_APPROX_SIMPLE压缩水平方向,垂直方向,对角线方向的元素,只保留该方向的终点坐标,例如一个矩形轮廓只需4个点来保存轮廓信息 cv2.CHAIN_APPROX_TC89_L1,CV_CHAIN_APPROX_TC89_KCOS使用teh-Chinl chain 近似算法 @return: 一个是轮廓本身,还有一个是每条轮廓对应的属性 cv2.drawContours(img,contours,-1,(0,255,0),3) @params1: 源图像; @params2: 该作为Python列表传递的轮廓; @params3: 轮廓的索引(在绘制单个轮廓时有用。要绘制所有轮廓,请传递-1); @params4: 其余参数是颜色; @params5: 厚度。寻找轮廓的步骤: 1. 原始图像; 2. 图像灰度化; 3. 图像二值化阈值处理; 4. 寻找轮廓; 5. 绘制轮廓。"""im = cv2.imread(path)plt.clf()plt.figure(figsize=(12, 5))# 1.原始图像处理# 为了 plt 显示正常原始图像,将 opencv 默认的 bgr 转换成 plt 支持的 rgbim_rgb = cv2.cvtColor(im, cv2.COLOR_BGR2RGB)plt.subplot(141)plt.title("origin")plt.imshow(im_rgb, cmap='gray')# 2.图像灰度化处理im_gray = cv2.cvtColor(im_rgb, cv2.COLOR_BGR2GRAY)plt.subplot(142)plt.title("gray")plt.imshow(im_gray, cmap='gray')# 3.二值化阈值处理ret, im_thresh = cv2.threshold(im_gray, 150, 200, cv2.THRESH_BINARY)plt.subplot(143)plt.title("threshold")plt.imshow(im_thresh, cmap='gray')# 4.寻找轮廓contours, hierarchy = cv2.findContours(im_thresh, # 寻找轮廓的图像 cv2.RETR_TREE, # 检索模式 cv2.CHAIN_APPROX_SIMPLE) # 轮廓的近似办法print(">>>大大小小的轮廓数量:", len(contours))# 5.绘制轮廓cv2.drawContours(im_rgb, # 源图像 contours, # 该作为Python列表传递的轮廓 -1, # 轮廓的索引,-1代表绘制所有 (255,0,0), # 颜色 5) # 厚度plt.subplot(144)plt.title("findContours")plt.imshow(im_rgb)>>>大大小小的轮廓数量: 34
### 2.轮廓处理
cnt = contours[9]# 特征矩m = cv2.moments(cnt)print(">>>特征矩", m)# 边界矩形框# (x,y)矩形左上角点坐标,w、h矩形宽度和高度x, y, w, h = cv2.boundingRect(cnt)print(">>>边界矩形框", x, y, w, h)# 轮廓面积# 可以在不同应用场景,去除轮廓面积太小的轮廓for i, cnt in enumerate(contours): area = cv2.contourArea(cnt) print(">>>轮廓 %d 的面积:%.2f" % (i+1, area))>>>特征矩 {'m00': 2.0, 'm10': 306.0, 'm01': 250.0, 'm20': 46818.33333333333, 'm11': 38250.0, 'm02': 31250.333333333332, 'm30': 7163307.0, 'm21': 5852291.666666667, 'm12': 4781301.0, 'm03': 3906375.0, 'mu20': 0.3333333333284827, 'mu11': 0.0, 'mu02': 0.3333333333321207, 'mu30': 1.862645149230957e-09, 'mu21': 9.167706593871117e-10, 'mu12': 1.8553691916167736e-10, 'mu03': 4.656612873077393e-10, 'nu20': 0.08333333333212067, 'nu11': 0.0, 'nu02': 0.08333333333303017, 'nu30': 3.2927225399135965e-10, 'nu21': 1.6206368751137233e-10, 'nu12': 3.279860342492059e-11, 'nu03': 8.231806349783991e-11}
>>>边界矩形框 152 124 3 3
>>>轮廓 1 的面积:39601.00
>>>轮廓 2 的面积:8.00
>>>轮廓 3 的面积:4.00
>>>轮廓 4 的面积:2.00
>>>轮廓 5 的面积:2.00
>>>轮廓 6 的面积:2.00
>>>轮廓 7 的面积:7.00
>>>轮廓 8 的面积:4.00
>>>轮廓 9 的面积:4.00
>>>轮廓 10 的面积:2.00
>>>轮廓 11 的面积:4.00
>>>轮廓 12 的面积:8.00
>>>轮廓 13 的面积:4.00
>>>轮廓 14 的面积:28.50
>>>轮廓 15 的面积:4.00
>>>轮廓 16 的面积:2.00
>>>轮廓 17 的面积:4.00
>>>轮廓 18 的面积:41.50
>>>轮廓 19 的面积:29.00
>>>轮廓 20 的面积:7.00
>>>轮廓 21 的面积:2.00
>>>轮廓 22 的面积:2.00
>>>轮廓 23 的面积:4.00
>>>轮廓 24 的面积:15.00
>>>轮廓 25 的面积:45.00
>>>轮廓 26 的面积:2.00
>>>轮廓 27 的面积:10.00
>>>轮廓 28 的面积:11234.00
>>>轮廓 29 的面积:0.00
>>>轮廓 30 的面积:0.00
>>>轮廓 31 的面积:0.00
>>>轮廓 32 的面积:0.00
>>>轮廓 33 的面积:1.50
>>>轮廓 34 的面积:259.50
颜色空间转换
### 1.颜色转换基础
cv2.cvtColor(im, cv2.COLOR_BGR2RGB)
* @params1: 原图像
* @params2: 图像转换参数
im = cv2.imread(path)plt.clf()plt.figure(figsize=(12, 5))# 1.原始图像处理# 为了 plt 显示正常原始图像,将 opencv 默认的 bgr 转换成 plt 支持的 rgbim_rgb = cv2.cvtColor(im, cv2.COLOR_BGR2RGB)plt.subplot(151)plt.title("origin")plt.imshow(im_rgb, cmap='gray')# 2.bgr 转换到 hsv 颜色空间im_hsv = cv2.cvtColor(im, cv2.COLOR_BGR2HSV)plt.subplot(152)plt.title("im_hsv")plt.imshow(im_hsv, cmap='gray')# hsv 通道分割h, s, v = cv2.split(im_hsv)plt.subplot(153)plt.title("h passageway")plt.imshow(h, cmap='gray')plt.subplot(154)plt.title("s passageway")plt.imshow(s, cmap='gray')plt.subplot(155)plt.title("s passageway")plt.imshow(s, cmap='gray')应用:对象追踪及检测
橙色瓶盖追踪及检测,详见后期单独例子。
## 图像增强
**图像增强主要作用:**
* 提高图像质量,比如光照亮度、各种滤镜;
* 扩展图像数据量,通过不同角度旋转、截取等来生成新的图像数据;
* .....
## 参考资料
[1] OpenCV中文官方文档
[2] HSV颜色空间介绍,https://www.cnblogs.com/wangyblzu/p/5710715.html
PS:需要本文项目的完整代码以及数据集的朋友,关注,在评论区私信小编即可分享给你,希望对读者朋友有所帮助!

