苹果公司股票价格时间序列的可视化分析
点赞、关注再看,养成良好习惯
Life is short, U need Python
初学Python,快来点我吧
案例:苹果公司股票价格时间序列的可视化分析
作者:PyQuant
博客:https://blog.csdn.net/qq_33499889
慕课:https://mooc1-2.chaoxing.com/course/207443619.html
声明:案例参考博雅大数据学院案例集
本案例适合作为大数据技术基础课程中数据可视化部分的配套教学案例。通过本案例,能够达到以下教学效果:
-
培养学生对真实数据进行可视化分析的能力。
- 案例中数据来源于苹果公司2015-2019年的股票数据,进行股票数据涨跌的可视化分析。
-
帮助学生进一步掌握常用图表的绘制方法。
- 案例中涉及到折线图、散点图、柱状图、直方图、核密度图和小提琴图等。
-
提高学生动手实践能力。
- 案例中使用Python中的两个常用可视化工具Matplotlib和Seaborn,提高学生绘制常用图表的实践能力。
可视化分析在大数据分析中扮演着相当重要的角色。可视化可以使数据更为清晰地传递信息,使数据分析更为生动具体。Matplotlib是一个Python库,用于2D绘图,而Seaborn是Python基于Matplotlib的数据可视化的库。Seaborn在Matplotlib的基础上进行了更高级的封装,从而使得作图更加简单方便,可以作出信息丰富且美观的图。本案例旨在帮助大家快速熟悉Matplotlib和Seaborn这两个可视化工具的操作。
目录
- 数据载入及预处理
- Matplotlib绘图
- 面向对象API绘图
- Seaborn绘图
1. 数据载入及预处理
本案例选择苹果公司的股票作为分析对象,来进行股票涨跌的分析;数据集来源:Python代码调取雅虎金融数据端口;其中数据集中每一列数据对应的含义如下表所示:
| 列名 | 类型 | 说明 |
|---|---|---|
| Date | Object | 观测日期 |
| Open | Float | 开盘价格 |
| High | Float | 最高成交价格 |
| Low | Float | 最低成交价格 |
| Close | Float | 收盘价格 |
| Volume | Int | 交易量 |
| Adj Close | Float | 调整后的收盘价格 |
- 导入数据集
import pandas as pd
import numpy as np
import datetime
import pandas_datareader.data as pdr             # 事先安装:pip install pandas-datareader

start = datetime.date(2015,1,2)
end = datetime.date(2019,12,31)
apple = pdr.get_data_yahoo('AAPL',start,end)
apple.head()
| High | Low | Open | Close | Volume | Adj Close | |
|---|---|---|---|---|---|---|
| Date | ||||||
| 2015-01-02 | 111.440002 | 107.349998 | 111.389999 | 109.330002 | 53204600.0 | 100.216454 |
| 2015-01-05 | 108.650002 | 105.410004 | 108.290001 | 106.250000 | 64285500.0 | 97.393181 |
| 2015-01-06 | 107.430000 | 104.629997 | 106.540001 | 106.260002 | 65797100.0 | 97.402374 |
| 2015-01-07 | 108.199997 | 106.699997 | 107.199997 | 107.750000 | 40105900.0 | 98.768150 |
| 2015-01-08 | 112.150002 | 108.699997 | 109.230003 | 111.889999 | 59364500.0 | 102.563072 |
apple.tail()
| High | Low | Open | Close | Volume | Adj Close | |
|---|---|---|---|---|---|---|
| Date | ||||||
| 2019-12-24 | 284.890015 | 282.920013 | 284.690002 | 284.269989 | 12119700.0 | 283.596924 |
| 2019-12-26 | 289.980011 | 284.700012 | 284.820007 | 289.910004 | 23280300.0 | 289.223602 |
| 2019-12-27 | 293.970001 | 288.119995 | 291.119995 | 289.799988 | 36566500.0 | 289.113831 |
| 2019-12-30 | 292.690002 | 285.220001 | 289.459991 | 291.519989 | 36028600.0 | 290.829773 |
| 2019-12-31 | 293.679993 | 289.519989 | 289.929993 | 293.649994 | 25201400.0 | 292.954712 |
apple_index = apple.index
mon = []
year = []
for item in apple_index:
    item = str(item)
    mon.append(int(item[5:7]))
    year.append(int(item[0:4]))
apple['month'] = mon
apple['year'] = year
apple.head()
| High | Low | Open | Close | Volume | Adj Close | month | year | |
|---|---|---|---|---|---|---|---|---|
| Date | ||||||||
| 2015-01-02 | 111.440002 | 107.349998 | 111.389999 | 109.330002 | 53204600.0 | 100.216454 | 1 | 2015 |
| 2015-01-05 | 108.650002 | 105.410004 | 108.290001 | 106.250000 | 64285500.0 | 97.393181 | 1 | 2015 |
| 2015-01-06 | 107.430000 | 104.629997 | 106.540001 | 106.260002 | 65797100.0 | 97.402374 | 1 | 2015 |
| 2015-01-07 | 108.199997 | 106.699997 | 107.199997 | 107.750000 | 40105900.0 | 98.768150 | 1 | 2015 |
| 2015-01-08 | 112.150002 | 108.699997 | 109.230003 | 111.889999 | 59364500.0 | 102.563072 | 1 | 2015 |
2. Matplotlib绘图
2.1 折线图
折线图 用于绘制连续型数据,展示数据变化的趋势。
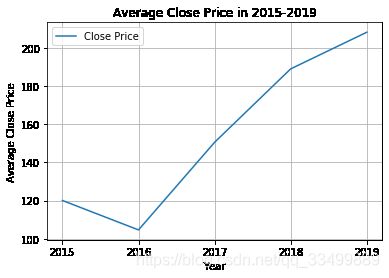
- 将数据以年为单位进行分组,以每年收盘价格的平均值绘图
%matplotlib inline
import matplotlib.pyplot as plt

x = apple.groupby('year').Close.mean().index
y = apple.groupby('year').Close.mean().values

plt.plot(x,y)
plt.xticks(x)

plt.show()
分析:从图中我们可以看出,苹果公司2015-2019年的股票收盘价格变化趋势,总体趋势走高,但是我们注意到2015年,出现下降趋势,但2016股票行情回暖并大幅度走高,且一直持续到2019年底。
备注:plot()函数—x为横坐标数据,y为纵坐标数据。除此之外,Matplotlib还提供了丰富的线形及其颜色,还可以调节线的宽度(linewidth),数据点的大小(markersize)及设置坐标轴的名字等。同时,可以利用grid()函数绘制网格线;默认为False,利用legend()函数设置图例,使用其loc参数设置图例的位置等。另外,Matplotlib允许多条折线绘制在一张图中。
- 美化 每年收盘价格的平均值曲线图
plt.plot(x,y,label='Close Price')

plt.grid(True)

plt.xticks(x)
plt.legend(loc = 'upper left')
plt.title('Average Close Price in 2015-2019')
plt.xlabel('Year')
plt.ylabel('Average Close Price')

plt.show()
- 绘制2015-2019年期间年成交量平均值的折线图
x1 = apple.groupby('year').Volume.mean().index
y1 = apple.groupby('year').Volume.mean().values

plt.plot(x1,y1,color='red',marker='o',linestyle='dashed',label='Close Price',linewidth=2, markersize=12)
# plt.plot(x1, y1, 'r--',label='Close Price', linewidth=2, markersize=12)

plt.xticks(x)
plt.legend(loc = 'upper right')
plt.title('Average volume in 2015-2019')
plt.xlabel('Year')
plt.ylabel('Average volume')
plt.grid(True)

plt.show()
分析:此图反映了2015-2019年间,苹果公司股票交易量的变化趋势,我们可以看出其交易量整体呈下降趋势,虽2017年开始有所转变,但2018年开始再次呈现下降趋势。结合上一个图,我们看出,虽然股票的价格升高,但是股票的成交量降低,所以由这两个图不能很明确的体现股票真正价值的变化,其股票价格的升高,可能是由于货币价值的变化,通货膨胀等,具体原因需要结合更多的数据集进行分析。
- 将数据以年为单位进行分组,把股票最低价格的平均值和最高价格的平均值绘制于同一个画布上
x1 = apple.groupby('year').Low.mean().index
y1 = apple.groupby('year').Low.mean().values
y2 = apple.groupby('year').High.mean().values

plt.plot(x1,y1, 'go-', label='High', linewidth=2)
plt.plot(x1,y2, 'rs--',  label='Low',linewidth=2)

plt.xticks(x)
plt.title('Average Price in 2015-2019')
plt.xlabel('Year')
plt.ylabel('Average Price')
plt.legend(('High', 'Low'),loc='upper left')
plt.grid(True)

plt.show()
分析:这里我们注意到,最高价格与最低价格之间的差距,2015年、2017年和2018年较大,这里也显示了股票市场的不确定性。
2.2 散点图
散点图是数据点在直角坐标系平面上的分布图,散点图表示因变量随自变量而变化的大致趋势,常用于回归分析中。
- 绘制2015-2019年随股票收盘价格的变化其成交量的散点图
x = apple.Close
y = apple.Volume

plt.scatter(x,y)
#or plt.plot(x,y,'o')

plt.title('Close Price and Volume in 2015-2019')
plt.xlabel('Close Price')
plt.ylabel('Volume')

plt.show()
分析:此图展示了2015-2019年随着股票收盘价格的变化,股票成交量的分布和聚合情况。
- 通过每个点的颜色来展示不同月份的收盘价格与成交量的分布,使用更多的参数对此散点图进行美化
例如,可以设定参数alpha改变数据点的透明度,设定参数marker改变数据点的形状,设定参数c为month设置不同分类的颜色,并使用colorbar()绘制色阶栏。
plt.scatter(x,y,marker = "^",c = apple['month'],alpha = 0.8)

plt.grid(True)
plt.colorbar()
plt.title('Close Price and Volume in 2015-2019')
plt.xlabel('Close Price')
plt.ylabel('Volume')

plt.show()
2.3 柱状图
柱状图是一种用矩形条表示分类数据的图表,这些矩形条的高度或长度与它们所表示的值成比例。柱状图可以垂直绘制,也可以水平绘制。
- 选择2015年的数据,进行绘制每月股票收盘价格平均值的柱状图
a_2015 = apple.loc[apple['year'] == 2015]
x = a_2015.groupby('month').Close.mean().index
y = a_2015.groupby('month').Close.mean().values

plt.bar(x,y,color = 'SkyBlue',hatch='o')

plt.grid(True)
plt.xlabel('Month')
plt.ylabel('Close Price')
plt.title('Bar Chart of Close Price in 2015')

plt.show()
分析:此柱状图表示2015年12个月收盘价格平均值的情况,从8月起,股票收盘价格开始较大幅下降。
备注:bar()函数绘制柱状图,主要的参数x为x轴的位置序列;y为柱形图的高度。参数hatch可以设置填充图形。
- 绘制2015年每月股票收盘价格和开盘价格平均值的横向柱状图
x = a_2015.groupby('month').Close.mean().index
y1 = a_2015.groupby('month').Close.mean().values
y2 = a_2015.groupby('month').Open.mean().values
width = 0.8

plt.barh(x-width/2, y1,width/2,label='Close Price')
plt.barh(x, y2,width/2,label='Open Price')

plt.xlabel('Price')
plt.ylabel('Month')
plt.legend(loc='upper center', bbox_to_anchor=(1.2,1))
plt.title('Close Price and Open Price in 2015')

plt.show()
备注:利用legend()函数,设置其参数使图例置于表格外以免遮挡图形。
2.4 直方图
直方图又称质量分布图,由一系列高度不等的纵向条纹或线段表示数据分布的情况。
- 使用2015年股票成交量的数据绘制直方图
x = a_2015.Volume

plt.hist(x,bins = 20,density=0,facecolor='green', edgecolor='black',alpha=1, histtype='bar')

plt.xlabel('Volume')
plt.ylabel('Probability')
plt.title('Histogram of Volume in 2015',fontsize = 16)

plt.show()
分析:此图展示了2015年股票交易量的分布直方图。直方图是用面积表示各组频数的多少,矩形的高度表示每一组的频数或频率,宽度则表示各组的组距,因此其高度与宽度均有意义。我们看到柱状图与直方图的形状很相似,但是实际上的含义及用处并不一样,直方图主要表示频率分布,其x轴为定量数据,而柱状图展示的是大小的比较,其x轴变量是分类数据。
备注:hist()有很多参数,其中6个比较常用。x为输入数据是必填,其他可选,包括bins:表示直方图的柱数,默认为10;density:表示是否将得到的直方图向量归一化,默认为0;facecolor: 表示直方图颜色;edgecolor: 表示直方图边框颜色;alpha: 表示透明度;histtype: 表示直方图类型(bar, barstacked,step,stepfilled)。
2.5 箱线图
箱线图又称为盒须图、盒式图或箱式图,是一种用于显示一组数据分散情况资料的统计图,它能显示出一组数据的最大非异常值、最小非异常值、中位数、及上下四分位数。
- 绘制2015年苹果股票开盘,收盘,最高及最低价格的分布
data = a_2015.groupby('month')['Open','Close','High','Low'].mean()

plt.grid(True)

plt.boxplot(x = data.values, labels = data.columns)
plt.title('Box Plot of Volume in 2015',fontsize = 16)

plt.show()
分析:根据“箱子”的含义,我们可以轻松看到每类价格的中位数及分布情况。箱形图不受异常值的影响,常用于识别异常值。箱式图经常用于可视化分析中,包含很多信息。
3. 面向对象API绘图
以上我们介绍的方法是函数方法做图,即使用基本的Matplotlib命令,接下来我们介绍另一种方法,即面向对象API的方法,此法为创建图的最佳方式。
3.1 创建子图
Matplotlib可以通过add_subplot()新增子图,指定figsize和dpi参数来指定图形大小,纵横比和DPI来创建图。
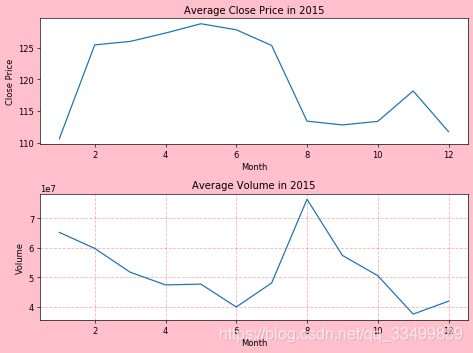
- 在同一个画布上均分成2*1的画布进行绘图。
x = a_2015.groupby('month').Close.mean().index
y1 = a_2015.groupby('month').Close.mean().values
y2 = a_2015.groupby('month').Volume.mean().values

fig = plt.figure()
ax1 = fig.add_subplot(2,1,1)
ax1.plot(x, y1)

ax2 = fig.add_subplot(2,1,2)
ax2.plot(x, y2)
ax2.grid(color='r', linestyle='--', linewidth=1,alpha=0.3)

plt.show()
备注:figure():创建一个空白画布,此函数有3个常用参数,依次为num:表示此图形的id,可为整型或者字符型;figsize:表示以英寸为单位的宽高; dpi:表示图形分辨率,相同的figsize,dpi越大则图形越大;facecolor:表示背景色;edgecolor:边框颜色;frameon:默认值True为绘制边框,如果为False则不绘制边框。其中,tight_layout()函数的目的是避免图表之间的重叠。
- 对上图进行添加坐标轴名称等信息
fig = plt.figure(num = "fig1",figsize=(8,6),dpi=60,facecolor="pink",edgecolor='green',frameon=True)

ax1 = fig.add_subplot(2,1,1)
ax1.plot(x, y1)
ax1.set_xlabel('Month')
ax1.set_ylabel('Close Price')
ax1.set_title('Average Close Price in 2015')

ax2 = fig.add_subplot(2,1,2)
ax2.plot(x, y2)
ax2.grid(color='r', linestyle='--', linewidth=1,alpha=0.3)
ax2.set_xlabel('Month')
ax2.set_ylabel('Volume')
ax2.set_title('Average Volume in 2015')

plt.tight_layout()
备注:通过使用set_xlabel(),set_ylabel()及set_title()设置图表的信息。
3.2 创建子区域
add_axes()函数可以为图表新增子区域,该区域可以座落在figure内任意位置,且该区域可任意设置大小
x = a_2015.groupby('month').Close.mean().index
y1 = a_2015.groupby('month').Close.mean().values
y2 = a_2015.groupby('month').Volume.mean().values

fig = plt.figure()

left, bottom, width, height = 0.1, 0.1, 0.8, 0.8
ax1 = fig.add_axes([left, bottom, width, height])
ax1.plot(x, y2, 'r')
ax1.set_title('Average Volume in 2015',fontsize = 15)
ax1.set_xlabel('Month')

left, bottom, width, height = 0.25, 0.6, 0.25, 0.25
ax2 = fig.add_axes([left, bottom, width, height])
ax2.plot(x,y1, 'b')
ax2.set_title('Close Price')

plt.show()
备注:Axes表示一个图表,通过add_axes()函数设置子区域的相对位置。
- 利用面向对象API的方法,绘制交易量和收盘价格的线图
import numpy as np

x = apple.groupby('year').Volume.mean().index
y1 = apple.groupby('year').Close.mean().values
y2 = apple.groupby('year').Volume.mean().values

fig = plt.figure()

ax1 = fig.add_subplot(111)
ax1.plot(x, y1,'r',label="Close Price")
ax1.legend(loc=1)
ax1.set_xlabel('Year')
ax1.set_ylabel('Y values for Close Price')

ax2 = ax1.twinx()
ax2.plot(x, y2, 'g',label = "Volume")
ax2.legend(loc=2)
ax2.set_ylabel('Y values for Volume')

fig.suptitle('Close Price and Volume', fontsize=16)
plt.xticks(x)
plt.grid(True)

plt.show()
备注:此图为共享y轴的例子,共享表示的就是x轴使用同一刻度线,twinx()函数表示共享x轴,twiny()表示共享y轴。
4. Seaborn绘图
Seaborn提供了很多高层封装的函数,帮助数据分析人员快速绘制美观的数据图形。
- 绘制2015年成交量的核密度估计
import seaborn as sns

sns.set()
sns.kdeplot(a_2015['Volume'],color="g",shade=True).set_title('KED of Volume in 2015',fontsize = 12)

plt.show()
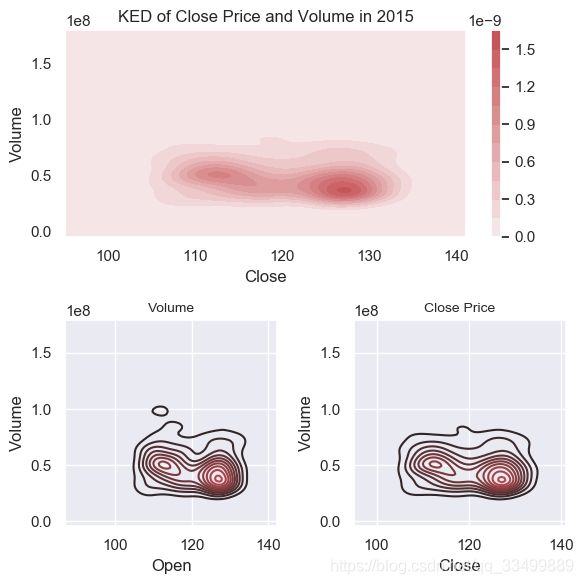
分析:核密度图可以理解为直方图的平滑曲线,是对真实的概率分布曲线进行的模拟。用于观察数据的分布。
备注1:导入Seaborn包后,绘图风格自动变为Seaborn风格。相较于Matplotlib代码简洁很多。
备注2:set()函数表示使用Seaborn的默认设置参数。shade设置为True时,kde曲线下面的区域会进行阴影处理,默认为False;color控制曲线及阴影的颜色
- 绘制多维数据的核密度图
例如:开盘价格,收盘价格与成交量的关系。
plt.figure(figsize=(6,6),dpi=100)

plt.subplot(2, 1, 1)
sns.kdeplot(a_2015["Close"], a_2015["Volume"],color = 'r',shade=True,cbar=True)
plt.title('KED of Close Price and Volume in 2015',fontsize = 12)

plt.subplot(2, 2, 3)
sns.kdeplot(a_2015["Open"], a_2015["Volume"],color = 'r')
plt.title("Volume", fontsize = 10)

plt.subplot(2, 2, 4)
sns.kdeplot(a_2015["Close"], a_2015["Volume"],color = 'r')
plt.title("Close Price",fontsize = 10)
plt.tight_layout()

plt.show()
备注:shade设置阴影,cbar设置色阶栏。
4.2 直方图
Seaborn可以用distplot()函数直接把直方图和核密度估计(KDE)一次性画出来,并且KDE可以通过kde参数进行设置,默认为True;通过bins参数设置分段数量。
- 导入Seaborn包后,绘制2015年股票成交量的直方图和核密度图
x = a_2015.Volume

kde_kws = {
     "color": "g", "lw": 3, "label": "KDE"}
sns.distplot(x, kde = True,bins = 30,color = "r",kde_kws = kde_kws )

plt.title('Histogram for Volume', fontsize = 16)

plt.show()
备注:kde_kws是一个字典,可以设置KDE相关的参数。
- 使用面向对象API的方法,绘制两个子图,分别表示2015年开盘价格和收盘价格的直方图
x = a_2015.Open
y = a_2015.Close

fig, (ax0, ax1) = plt.subplots(2, 1)
fig.subplots_adjust(hspace=0.5)          # 表格之间空间

ax0 = sns.distplot(x,ax=ax0,rug=True,color = 'green')
ax1 = sns.distplot(y,ax=ax1,rug=True,color = 'red')

fig.suptitle('Volume and Close Price in 2015', fontsize = 16)

plt.show()
分析:此图展示了开盘与收盘价格的密度分布,总体来说,其分布基本类似。
备注:rug设置是否生成观测数值的小细条。
4.3 散点图
Seaborn中可以使用scatterplot() 函数绘制散点图。
- 为了方便分析,我们新建一列
tend,把2015年股票收盘价格小于2015年收盘价格平均值的日子设为0,大于及等于2015年平均值的日子设为1
ls = []
for item in a_2015.Close:
    if float(item) < a_2015.Close.mean():
        ls.append(0)
    else :ls.append(1)

a_2015 = a_2015.assign(tend=ls)
a_2015.tail()
| High | Low | Open | Close | Volume | Adj Close | month | year | tend | |
|---|---|---|---|---|---|---|---|---|---|
| Date | |||||||||
| 2015-12-24 | 109.000000 | 107.949997 | 109.000000 | 108.029999 | 13570400.0 | 100.712036 | 12 | 2015 | 0 |
| 2015-12-28 | 107.690002 | 106.180000 | 107.589996 | 106.820000 | 26704200.0 | 99.584007 | 12 | 2015 | 0 |
| 2015-12-29 | 109.430000 | 106.860001 | 106.959999 | 108.739998 | 30931200.0 | 101.373940 | 12 | 2015 | 0 |
| 2015-12-30 | 108.699997 | 107.180000 | 108.580002 | 107.320000 | 25213800.0 | 100.050133 | 12 | 2015 | 0 |
| 2015-12-31 | 107.029999 | 104.820000 | 107.010002 | 105.260002 | 40912300.0 | 98.129669 | 12 | 2015 | 0 |
- 绘制2015年收盘价格与成交量的散点图
sns.scatterplot(x = 'Close', y = 'Volume', hue='month',data=a_2015)

plt.title('Close VS. Volume in 2015')

plt.show()
分析:此图展示了2015年收盘价格与成交量之间的关系,由颜色我们可以看出,前半年的收盘股票价格普遍较高,此结果与我们之前的分析一致。
备注:参数hue用于指定额外的分组特征,其值为分组数据
- 使用
lmplot()函数可以得到两个特征之间的线性回归直线
lm = sns.lmplot(x = 'Close', y = 'Volume', data=a_2015)

lm.fig.suptitle("Close VS. Volume in 2015", fontsize=12)

plt.show()
4.4 联合绘图
Seaborn可以可视化两个变量的双变量分布,joinplot()函数可以显示两个变量之间的双变量关系以及每个变量的单变量分布。
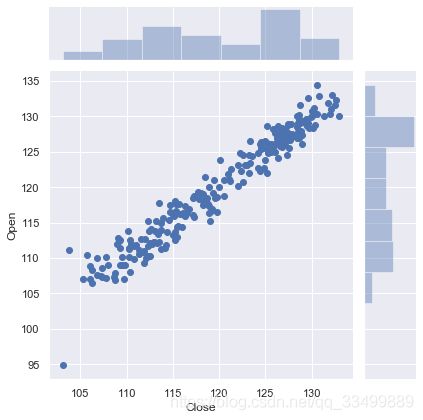
- 绘制2015年收盘价格与开盘价格的联合分布图
sns.jointplot(x = 'Close', y = 'Open', data=a_2015)

plt.show()
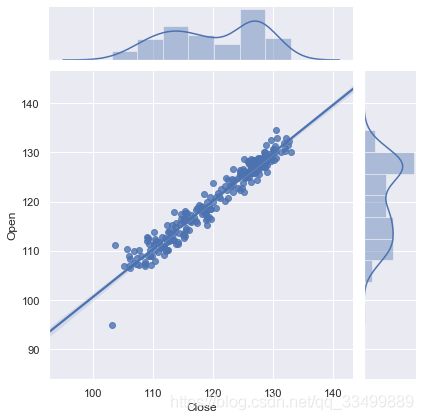
分析:此图展示了2015年收盘价格与开盘价格之间的关系,我们可以知道呈明显的正相关关系。jointplot()函数将直方图和散点图同时绘制出来。
备注:通过参数kind设置图形的类型:scatter,reg,resid,kde,hex。
- 为图像添加回归拟合直线
sns.jointplot(x = 'Close', y = 'Open', data=a_2015,kind="reg")

plt.show()
- 绘制2015年收盘价格和开盘价格联合核密度图
sns.jointplot(x = 'Close', y = 'Open', data=a_2015,color = 'g',kind="kde")

plt.show()
- 绘制2015年收盘价格和开盘价格散点图,然后添加联合密度分布图
sns.jointplot(x = 'Close', y = 'Open', data=a_2015, color="k").plot_joint(sns.kdeplot, zorder=0, n_levels=6)

plt.show()
备注:plot_joint函数可以将很多绘图形式放在同一张图表中。
4.5 点对图
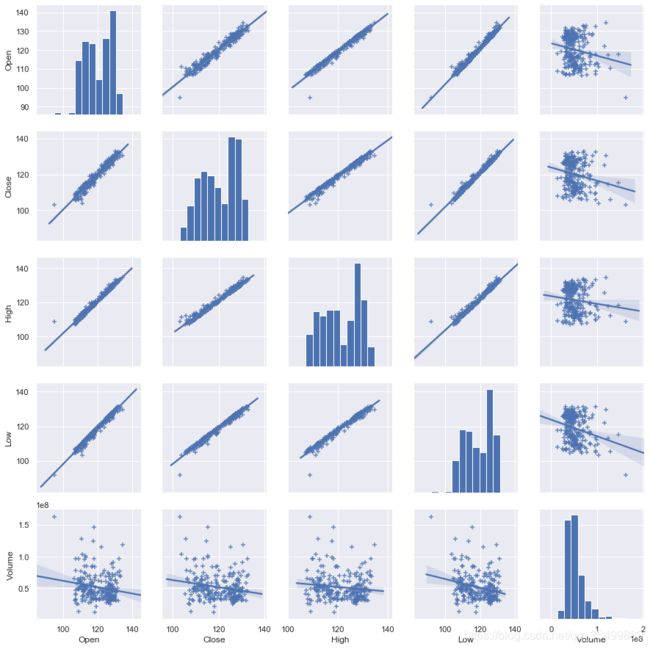
pairplot()可以完成点对图的绘制,多用于展示变量之间的相关性;对角线上的直方图允许我们看到单个变量的分布,而上下三角形上的散点图显示了两个变量之间的关系。
- 绘制
open,close,high,low与volume的点对图
sns.pairplot(a_2015[['Open','Close','High','Low','Volume']],kind="reg", markers='+')

plt.show()
分析:由图可知,open,close,high和low之间均呈正相关关系,与volume相关性较不明显。
备注:参数kind设置为reg时,每个散点图将绘制线性回归拟合模型图像。
结论:由此可见,Seaborn提供的操作更为简洁,提供的图像更加多样及美观。
4.6 小提琴图
小提琴图是箱线图和核密度图的结合,在Seaborn中,使用violinplot()函数绘制。
- 绘制小提琴图
fig,ax=plt.subplots(nrows=2,ncols=2,figsize=(15,15))

ax[0,0] = sns.violinplot(x='month', y = 'Close',data = a_2015,ax=ax[0,0])
ax[0,0].set_title("Violin chart")

ax[0,1] = sns.violinplot(x='month', y = 'Close',hue ='tend',data = a_2015,ax=ax[0,1])
ax[0,1].set_title("Violin Chart with hue")

ax[1,0] = sns.violinplot(x='month', y = 'Close',hue ='tend',split = True,data = a_2015,ax=ax[1,0])
ax[1,0].set_title("Violin Chart with hue side")

ax[1,0] = sns.violinplot(x='year', y = 'Close',data = apple,ax=ax[1,1])
ax[1,1].set_title("Violin Chart for Close Price in 2015-2018")

plt.show()
分析:此图含有的信息量也有很多,图一展示了2015年中12月,每个月的收盘价格的分布情况;图二展示了,当有特征变量加入之后,收盘价格的分布情况,图三为图二的升级版,将特征变量分布在小提琴图的两侧;图四显示了2013-2015年收盘价格的分布情况。
备注:参数hue用于指定额外的分组特征,其值为分组数据;如若想要将图的分组分别绘制在箱式图的两边, 使用split参数设置。
补充:
Matplotlib和Seaborn可视化中不同参数可以得到不同的效果,更加美观的绘图方法参见 官网。
- Matplotlib官网:https://matplotlib.org/
- Seaborn官网:https://seaborn.pydata.org/
- Pandas官网:https://pandas.pydata.org/
- Plotly官网:https://plot.ly/
- 写作不易,切勿白剽
- 博友们的点赞和关注就是对博主坚持写作的最大鼓励
- 持续更新,未完待续…

