Python之手写数字识别
2020.2.15:原本今天是一个准备开学的日子,但是由于疫情,延迟开学了,所以在这个最后的日子,我打算总结一下这个假期学到的东西吧
- 先总结一下,深度学习:手写数字识别
- 下一篇博文,总结一下:爬虫
手写数字识别
一、准备工作
-
在自己电脑上跑,电脑散热扇声音很大,于是注册了kaggle,在这上面跑,感觉好一些。
申请kaggle,遇到了点问题:申请时无法显示验证码
解决办法:在网上找了许多方案,在360浏览器上安装谷歌插件,然后就可以了,大家可以自行百度,百度上有很多方法。 -
数据准备
import tensorflow as tf
from tensorflow.examples.tutorials.mnist import input_data
大部分教程上都用这个方式加载数据集,但是tensorflow.example是tensorflow1.x 版本里的,但是kaggle里tensorflow是2.3的,没有这个模块。幸好在kaggle中能够添加数据集。
- 数据加载
import tensorflow as tf
import pandas as pd
fashion_mnist_test = pd.read_csv("../input/mnist-in-csv/mnist_test.csv")
fashion_mnist_train = pd.read_csv("../input/mnist-in-csv/mnist_train.csv")
使用 pandas 读入数据
4. 数据查看
print("数据类型:",type(fashion_mnist_train))
print("数据形状:",fashion_mnist_train.shape)
数据类型: <class 'pandas.core.frame.DataFrame'>
数据形状: (60000, 785)
由此可以看出:数据是60000行785列,所以1个数据标签值+784个数据集,所以要 把数据分开,并把数据集(784) 变形为(28*28)的。
5. 数据整理
y_train = fashion_mnist_train["label"]
x_train = fashion_mnist_train.drop(labels = ["label"],axis = 1) #axis = 1 表示删除列
y_test = fashion_mnist_test["label"]
x_test = fashion_mnist_test.drop(labels = ["label"],axis=1)
x_train:获取的训练集 label 下的数据,然后删掉“label”列,剩下的给x_train。
x_train是DataFrame数据类型,把二维数据变成三维的(-1,28,28):-1表示自动计算。
x_train = x_train.values.reshape(-1,28,28)
print("x_train的数据格式:",x_train.shape)
x_train的数据格式: (60000, 28, 28)
y_train = tf.keras.utils.to_categorical(Y_train) #one-hot
print(y_train)
[[0. 0. 0. ... 0. 0. 0.]
 [1. 0. 0. ... 0. 0. 0.]
 [0. 0. 0. ... 0. 0. 0.]
 ...
 [0. 0. 0. ... 0. 0. 0.]
 [0. 0. 0. ... 0. 0. 0.]
 [0. 0. 0. ... 0. 1. 0.]]
把标签值用one-hot编码 。
模型建立
- 模型建立
x_train = tf.expand_dims(x_train,3)#卷积层输入时 需要四维数据
model = tf.keras.Sequential()      #模型建立
#添加卷积层
model.add(tf.keras.layers.Conv2D(input_shape=(28,28,1),filters=32, kernel_size=(5,5),activation='relu'))
model.add(tf.keras.layers.MaxPool2D(pool_size=(2,2),strides=(2,2)))
model.add(tf.keras.layers.Flatten())
model.add(tf.keras.layers.Dense(128,activation='relu'))
model.add(tf.keras.layers.Dense(10,activation='softmax'))
#损失函数:交叉熵,同时获取准确率 acc
model.compile(optimizer='adam',loss='categorical_crossentropy',metrics=['acc'])
#开始训练,用history接一下
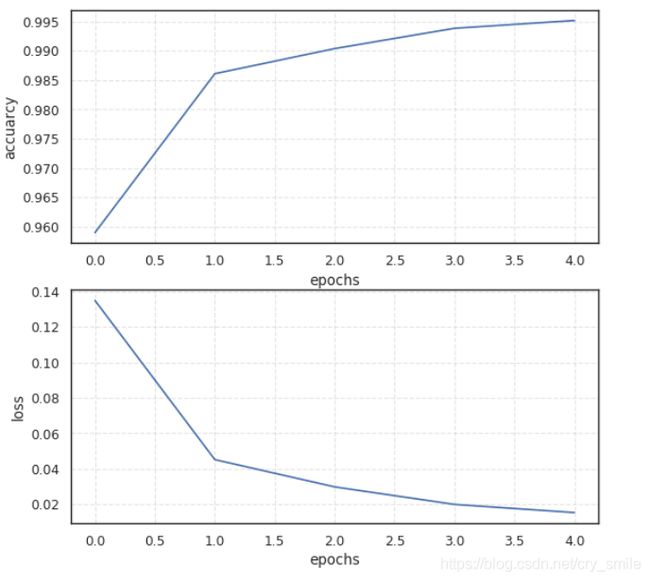
history = model.fit(x_train, y_train, epochs=5)   #训练5次 效果就挺好
Train on 60000 samples
Epoch 1/5
60000/60000 [==============================] - 24s 402us/sample - loss: 0.1349 - acc: 0.9590
Epoch 2/5
60000/60000 [==============================] - 26s 428us/sample - loss: 0.0451 - acc: 0.9861
Epoch 3/5
60000/60000 [==============================] - 24s 392us/sample - loss: 0.0297 - acc: 0.9904
Epoch 4/5
60000/60000 [==============================] - 24s 405us/sample - loss: 0.0199 - acc: 0.9938
Epoch 5/5
60000/60000 [==============================] - 24s 395us/sample - loss: 0.0153 - acc: 0.9951
60000张图片,5次迭代,可以看到 准确率acc达到了99.51%。
误差和准确率
用python画图也是很好看的,大家可以多学一点,展示效果会好许多。
plt.figure(figsize=(8,8),dpi=80)
plt.subplot('211')
plt.plot(history.epoch, history.history.get('acc'))
plt.grid(True, linestyle="--",alpha=0.5)
plt.xlabel("epochs")
plt.ylabel("accuarcy")
plt.subplot('212')
plt.plot(history.epoch, history.history.get('loss'))
plt.xlabel("epochs")
plt.ylabel("loss")
plt.grid(True, linestyle="--",alpha=0.5)
检验
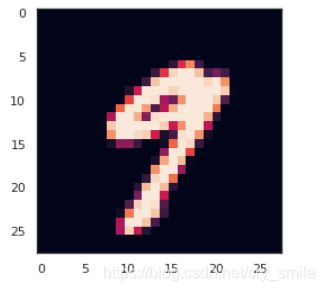
随便选择一个数字图片,带入检验
predict = model.predict(x_test)
print("预测数据为:",np.argmax(predict[num]))
plt.imshow(x_test[20])
预测数据为: 9


