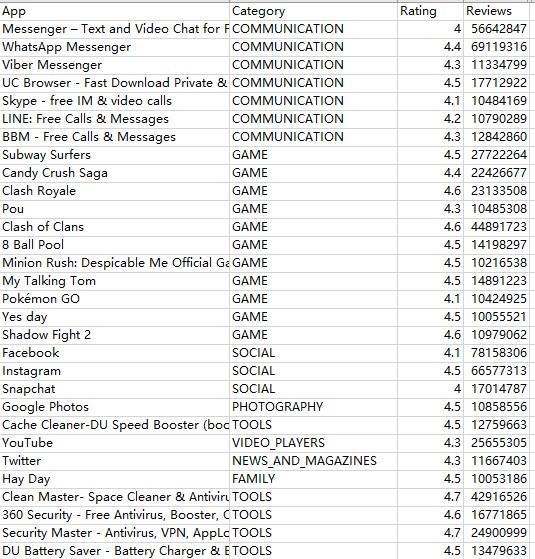
数据来源于kaggle:https://www.kaggle.com/lava18/google-play-store-apps
数据主要包含了APP名称、所属类别、用户评论数、评分、价格、大小等。这次的数据处理以及可视化由python完成,这是我的第一个小项目,希望以后能够做得更好。
首先导入相关的库和数据
import pandas as pd
import numpy as np
import matplotlib.pyplot as plt
import seaborn as sns

df = pd.read_csv('E:\PYTHON\google\google-play-store-apps\googleplaystore.csv')
随后对数据进行清洗以及数据预处理
#首先去除重复数据
df.drop_duplicates(subset='App',inplace = True)
df = df[df['Android Ver'] != np.nan]
df = df[df['Android Ver'] != 'NaN']
df = df[df['Installs'] != 'Free']
df = df[df['Installs'] != 'Paid']
df = df.dropna(subset=['Type','Content Rating','Current Ver','Android Ver'])
作完这些步骤后用df.info()观察只有rating存在缺失值了,暂且不动,先对特征进行预处理。
Installs中存在‘+’,‘,’等符号需要去除并且转化为数值型
Size中存在'Varies with device',‘M’,‘k’也需要去除,并且转化为数值型
‘Price'中存在'$',需要去除并转化为数值型
df.Reviews = df.Reviews.astype('int64')
df['Installs'] = df['Installs'].apply(lambda x :x.replace('+','') if '+' in str(x) else x)
df['Installs'] = df['Installs'].apply(lambda x : x.replace(',','') if ',' in str(x) else x)
df['Installs'] = df['Installs'].apply(lambda x : float(x))

df['Size'] = df['Size'].apply(lambda x : str(x).replace('Varies with device','NaN') if 'Varies with device' in str(x) else x)
df['Size'] = df['Size'].apply(lambda x : str(x).replace('M','') if 'M' in str(x) else x)
df['Size'] = df['Size'].apply(lambda x : float(str(x).replace('k',''))/1000 if 'k' in str(x) else x)
df['Size'] = df['Size'].apply(lambda x : float(x))

df['Price'] = df['Price'].apply(lambda x : str(x).replace('$','') if '$' in str(x) else str(x))
df['Price'] = df['Price'].apply(lambda x :float(x))
对数据进行可视化展示,观察总体的趋势
labels = df['Type'].value_counts(sort=True).index
sizes = df['Type'].value_counts(sort=True)
explode = (0.1,0)
plt.pie(sizes,explode = explode,labels = labels,autopct='%1.1f%%',startangle=270)
plt.title('Payment category')
df_counts = df.groupby(['Category','Type']).size().unstack().sort_values(by = 'Free',ascending=False)
df_counts.plot.bar(figsize = (16,7))
plt.ylabel('Counts')
plt.legend(fontsize = 20)

df_counts['free_proportion'] = df_counts['Free']/(df['Type'].value_counts()['Free'])
df_counts['paid_proportion'] = df_counts['Paid']/(df['Type'].value_counts()['Paid'])
plt.figure(figsize=(16,7))
df_counts[['free_proportion','paid_proportion']].plot(kind='bar',figsize=(16,7))
观察在是否付费的情况下各APP的数量情况
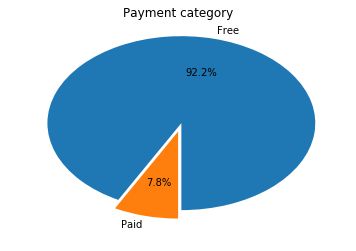
第一张图:免费APP数量远高于付费APP数量
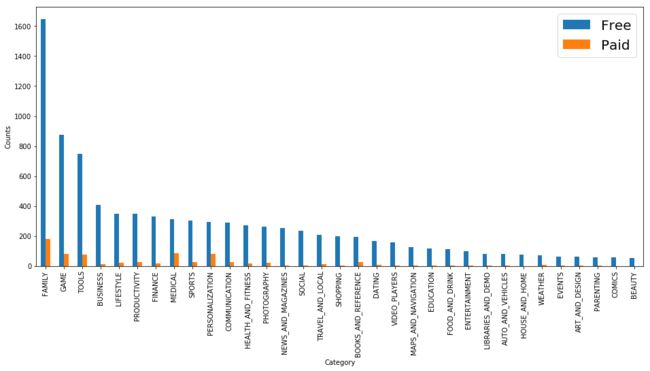
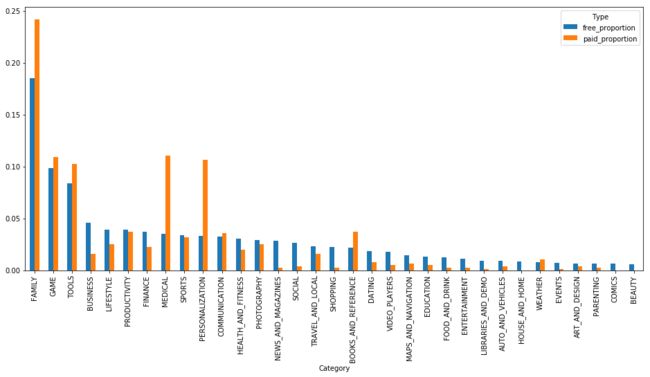
第二张图:FAMILY、GAME、TOOLS为免费APP数量的前三,付费APP的数量与免费APP的数量有一定的相关性,通过计算是否付费情况下各类APP数量占总数的比值进行进一步观察。
第三张图:在付费APP中,FAMILY的比例仍然最高,GAME、TOOLS的比值也较高。值得注意的是MEDICAL、PERSONALIZATION这类APP存在较多的付费类型,而BUSINESS类APP付费得较少。
随后来观察下付费APP的价格分布情况
plt.figure(figsize=(16,7))
df[df.Type != 'Free']['Price'].plot(kind = 'hist',bins = 100)
plt.xlabel('Price')
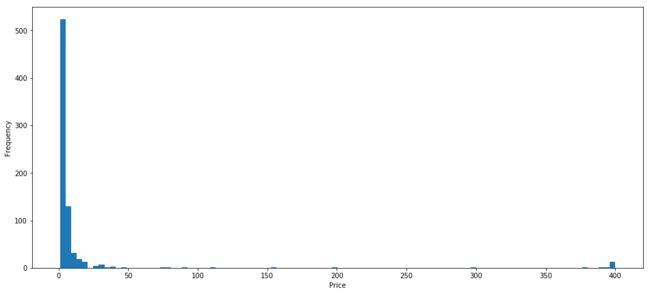
价格大多数分布在50以内,甚至20。有少数大于350的,我们来看看是什么
df_highprice =  df[df['Price'] > 350]
print(df_highprice.App)
4197 most expensive app (H)
4362 I'm rich
4367 I'm Rich - Trump Edition
5351 I am rich
5354 I am Rich Plus
5356 I Am Rich Premium
5357 I am extremely Rich
5358 I am Rich!
5359 I am rich(premium)
5362 I Am Rich Pro
5364 I am rich (Most expensive app)
5366 I Am Rich
5369 I am Rich
5373 I AM RICH PRO PLUS
9917 Eu Sou Rico
9934 I'm Rich/Eu sou Rico/أنا غني/我很有錢
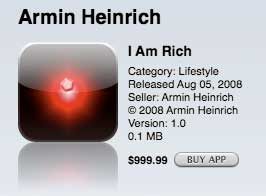
这类APP的名字基本都是统一的,只不过在全世界有不同语言的版本。这类APP的唯一用处就是证明下载这类APP的人是很有钱的人而已。
《I'm Rich》的功能非常单纯,甚至可以说没有功能,在打开App 后,你只会看到一颗发光的红色钻石:
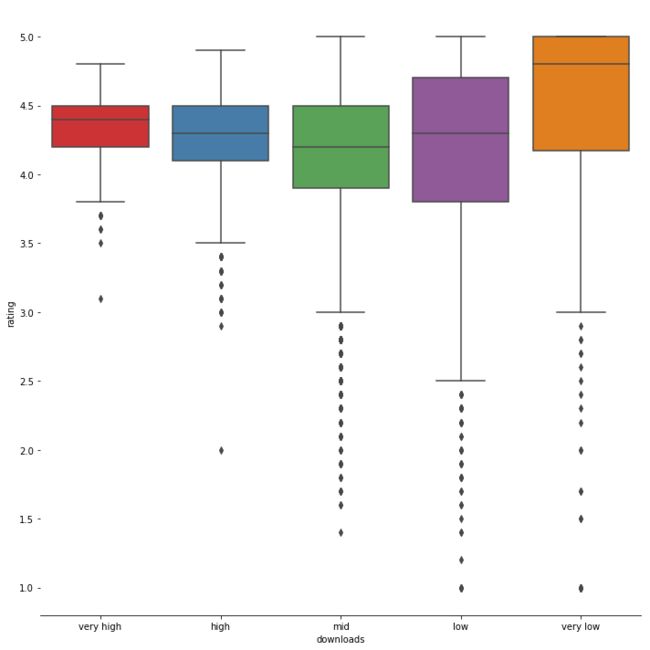
接下来对rating(评分)进行分析,首先要去除rating为空值的数据,并结合下载量、评论数、对应人群进行分析
df_rating = df[df['Rating'].notnull()]
df_rating.loc[df['Installs'] < 101 ,'downloads'] = 'very low'
df_rating.loc[(df['Installs'] < 10001)&(df['Installs'] >= 101) ,'downloads'] = 'low'
df_rating.loc[(df['Installs'] < 1000001)&(df['Installs'] >= 1001) ,'downloads'] = 'mid'
df_rating.loc[(df['Installs'] < 10000001)&(df['Installs'] >= 1000001) ,'downloads'] = 'high'
df_rating.loc[(df['Installs'] < 1000000001)&(df['Installs'] >= 10000001) ,'downloads'] = 'very high'
g = sns.catplot(x='downloads',y='Rating',data = df_rating,kind='box',height=10,palette='Set1',order=['very high','high','mid','low','very low'])
g.despine(left=True)
g.set_ylabels('rating')
print(df_rating.groupby('downloads').mean()['Rating'])
df_rating.loc[df['Reviews'] < 101 ,'Number of comments '] = 'very low'
df_rating.loc[(df['Reviews'] < 10001)&(df['Reviews'] >= 101) ,'Number of comments '] = 'low'
df_rating.loc[(df['Reviews'] < 1000001)&(df['Reviews'] >= 1001) ,'Number of comments '] = 'mid'
df_rating.loc[(df['Reviews'] < 10000001)&(df['Reviews'] >= 1000001) ,'Number of comments '] = 'high'
df_rating.loc[(df['Reviews'] < 78158307)&(df['Reviews'] >= 10000001) ,'Number of comments '] = 'very high'

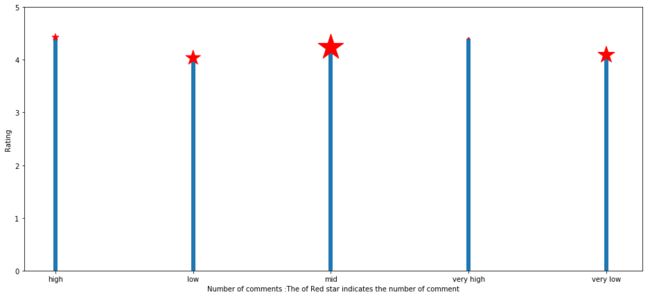
df_reviews = df_rating.groupby('Number of comments ')['Rating'].agg(['count','mean']).reset_index()
plt.figure(figsize = (16,7))
plt.bar(x=df_reviews['Number of comments '],height = df_reviews['mean'],width = 0.03,zorder = 1)
plt.scatter(df_reviews['Number of comments '],df_reviews['mean'],s =list((df_reviews['count'].values/3).astype(int)),color='red',zorder = 2,marker = '*')
plt.ylim(0,5)
plt.ylabel('Rating')
plt.xlabel('Number of comments :The of Red star indicates the number of comment')
df_reviews.sort_values('mean')
downloads rating
high 4.271049
low 4.088268
mid 4.119602
very high 4.353456
very low 4.421136
下载量越高,APP的评分会更加趋于稳定。在评分上,除了极少数下载量的APP,下载数越高,评分越高,这是否可以间接说明,下载量高的自然口碑也会好。
Number of comments count mean
1 low 1486 4.035599
4 very low 1906 4.091815
2 mid 4449 4.234390
3 very high 30 4.403333
0 high 319 4.428527
评论数集中100~1000001较多,并且数量与评分也存在一定联系,评论数量越多的往往评分也相对较高。这些结果表明了,只要做出来APP能够引起更多人的下载或者评论,往往评分口碑也越好,我们通常看许多热门APP看似骂的人挺多,其实是因为基数大而已。
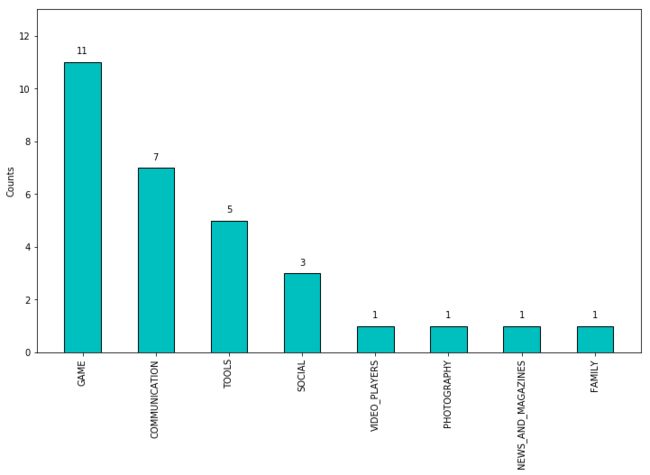
让我们来看看那些下载量高,评论数高的APP
df_heat = df.loc[(df['Installs']>10000001)&(df['Reviews']>10000000),:]
g = df_heat.groupby('Category').size().sort_values(ascending=False)
plt.figure(figsize=(12,7))
plt.bar(g.index,g.values,color = 'c',edgecolor='black',width=0.5)
plt.xticks(rotation=90)
plt.ylabel('Counts')
plt.ylim(0,13)
#plt.grid(axis = 'y')
for a,b in zip(g.index,g.values):
    plt.text(a,b+0.3,b,ha='center')
plt.show()
#df_heat.to_csv()
这就是google app store大致的情况,第一次弄可能还缺少一些好的点子,分析脉络也不清晰,下次整理得更规整再放上,先这样开一个头。
