【ROS教程 005】ROS可视化
在ROS系统中它可以通过一些通用工具轻松绘制标量数据图,它要求对每一个标量字段数据分别绘制成二维曲线。
(1)用rxplot画出时间趋势曲线
在ROS系统中,标量数据可以根据消息中提供的时间戳作为时间序列绘制图形,然后我们能够在y轴上使用rxplot工具绘制标量数据。为了展示rxplot工具我们使用example4节点。它在两个不同的主题中分别发布一个标量和一个矢量(非标量),这两个主题分别是温度(temp)和加速度(accel)。在这些消息中的值是随机生成的,所以它们没有实际意义,仅用于示范曲线绘制。首先运行节点
$ rosrun chapter3_tutorials example4通过rostopic list能够看到两个活动主题temp和accel。对于标量数据,我们通常使用data作为字段名来表示实际的值。对于temp主题,以Int32为数据格式,使用命令:
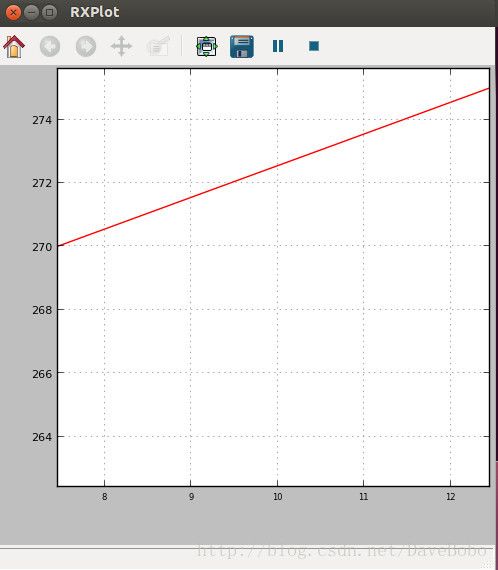
$ rxplot /temp/data如果节点正常运行,我们能够看到消息中的数值随时间变化的图形
在示例节点提供的accel主题里,我们看到一个Vector3的消息,我们可以在一个plot图中分别绘制三个字段的曲线,这是rxplot的优势,命令为:
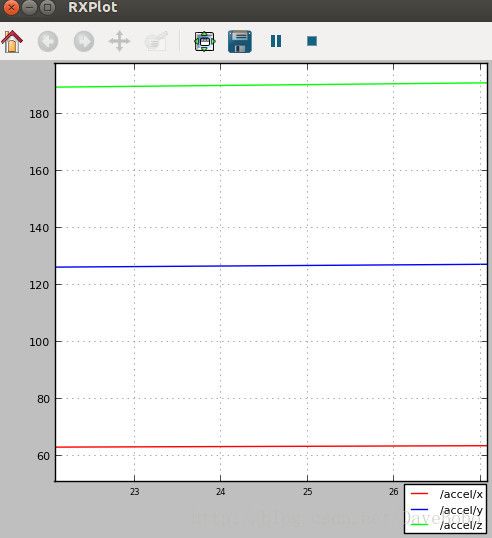
$ rxplot /accel/x:y:z$ rxplot /accel/x /accel/y /accel/z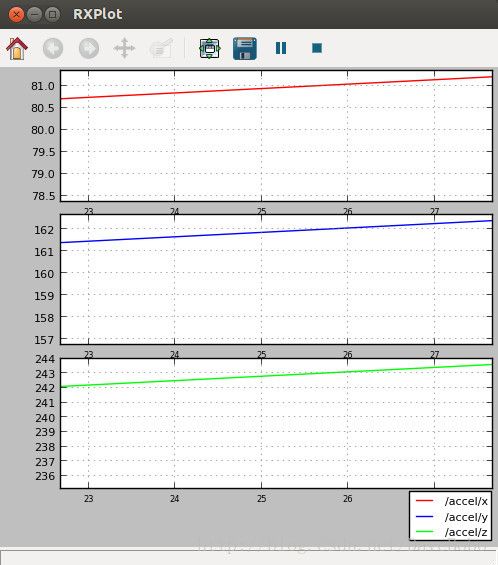
(2)显示单一图片
在ROS系统中我们可以创建一个节点,在节点中展示来自即插即用摄像头的图像。这里我使用罗技摄像头来完成这项工作。在example6节点中,通过调用OpenCV库插入一段基本的摄像头捕捉程序,在后在ROS中将采集到的cv::Mat图像转换到ROS图像,这样就可以在主题中发布了,这个节点会在/camera主题里发布图像帧。
example6.cpp中的程序:
#include <ros/ros.h>

#include <image_transport/image_transport.h>
#include <cv_bridge/cv_bridge.h>
#include <sensor_msgs/image_encodings.h>

#include <opencv2/highgui/highgui.hpp>

int main( int argc, char **argv )
{

  ros::init( argc, argv, "example6" );

  ros::NodeHandle n;

  // Open camera with CAMERA_INDEX (webcam is typically #0).
  const int CAMERA_INDEX = 0;
  cv::VideoCapture capture( CAMERA_INDEX );
  if( not capture.isOpened() )
  {
  ROS_ERROR_STREAM(
  "Failed to open camera with index " << CAMERA_INDEX << "!"
  );
  ros::shutdown();
  }

  image_transport::ImageTransport it( n );
  image_transport::Publisher pub_image = it.advertise( "camera", 1 );

  cv_bridge::CvImagePtr frame = boost::make_shared< cv_bridge::CvImage >();
  frame->encoding = sensor_msgs::image_encodings::BGR8;

  while( ros::ok() ) {
  capture >> frame->image;

  if( frame->image.empty() )
  {
  ROS_ERROR_STREAM( "Failed to capture frame!" );
  ros::shutdown();
  }

  frame->header.stamp = ros::Time::now();
  pub_image.publish( frame->toImageMsg() );

  cv::waitKey( 3 );

  ros::spinOnce();
  }

  capture.release();

  return EXIT_SUCCESS;

}
example6.launch中内容:
<launch>

  <node pkg="chapter3_tutorials" type="example6" name="example6"
  output="screen"/>
launch>
manifest.xml中的内容需要添加我们用到的其他库
<package>
  <description brief="chapter3_tutorials">

  chapter3_tutorials

  description>
  <author>Enriqueauthor>
  <license>BSDlicense>
  <review status="unreviewed" notes=""/>
  <url>http://ros.org/wiki/chapter3_tutorialsurl>
  <depend package="std_msgs"/>
  <depend package="geometry_msgs"/>
  <depend package="sensor_msgs"/>
  <depend package="visualization_msgs"/>
  <depend package="rospy"/>
  <depend package="roscpp"/>
  <depend package="opencv2"/>
  <depend package="cv_bridge"/>
  <depend package="image_transport"/>
  <depend package="pcl"/>
  <depend package="pcl_ros"/>

package>
CMakeLists.txt增加相关内容并编译通过后,我们将使用launch文件运行节点并进行图像捕捉和发布工作。
启动节点
$ roslaunch chapter3_tutorials example6.launch显示单一图片
$ rosrun image_view image_view image:=/camera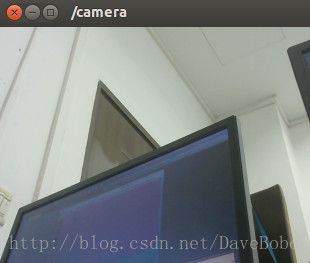
(3)3D可视化
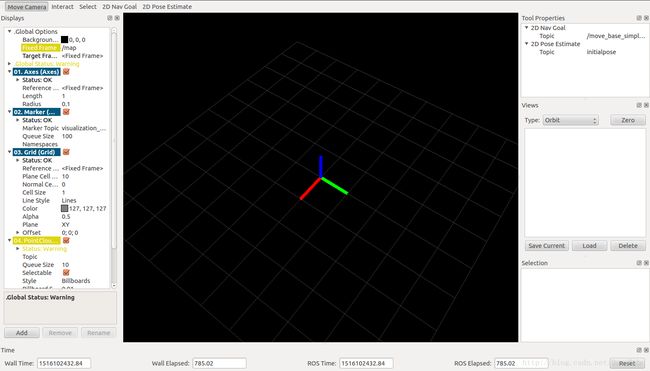
ROS系统中的rviz工具集成了能够完成3D数据处理的OpenGL接口,能够将传感器数据在模型化世界中展示。用以下命令来启动rviz
$ rosrun rviz rvizAdd部分参数项如下图所示:
(4)保存和回放数据
ROS能够存储所有节点通过主题发布的消息,消息记录包正是一个包含各个主题所发消息的容器,用于记录机器人各个节点间的会话过程。
step1 使用rosbag在包文件中记录数据,先运行节点
$ rosrun chapter3_tutorials example4现在有两个选择,一个是记录所有的主题
$ rosbag record -a第二是仅记录一些特定(用户自定义)的主题
$ rosbag record /temp /accelstep2 回放消息记录文件,移动到想要回放消息记录包文件所在的文件夹下,并输入以下命令:
$ rosbag play filenameReferences:
[1]. Aaron Martinez Enrique Fern andez, ROS机器人程序设计[B], P59-74, 2014.
