模型评估:评估矩阵和打分
文章目录
- 目标优先
- 二分类问题的评价指标
-
- 第一类错误和第二类错误
- 非均匀数据集
- 混淆矩阵、正确率、精确率、召回率和f-score
- 不知道标签均匀性的情况
- 精度-召回曲线和ROC曲线
-
- 精度-召回曲线( precision-recall curve)
- ROC和AUC
截至目前为止, 我们都一直都是用accuracy正确率来评价分类模型的表现,用 R 2 R^2 R2. 但是,这只是评价给定数据集合上监督学习模型性能的众多指标中的两个,在实际应用时,选择合适的评价矩阵来挑选合适的模型和参数非常重要。
目标优先
首先需要谨记的是:应用机器学习的最终目标是什么。实际场景中,我们通常不仅仅关注于预测的正确率,很多时候这些预测值还是后续更重要决策过程的一部分。
在挑选机器学习评价矩阵之前,应该想一想应用上更高层次的目标,这个目标常被称为“商业矩阵”。 选择特定机器学习算法的结果被称为商业影响(business impact)。 这个更高级别的目标可能是避免交通事故,或者减少医疗事故,或者使得很多网民受益,等等。在选择模型或者调试参数的时候,应该选择那些在商业矩阵上最有正向影响力的。这往往比较难,因为评估特定模型的商业影响力需要将其放到实际生产环境中应用才能知道,或者说,需要对商业目标有更加深入的理解。
二分类问题的评价指标
第一类错误和第二类错误
二分类问题很常见,在二分类问题中,通常有两类:positive VS negative.
以病人诊断为例,对于任何一个诊断环节,阳性代表有病,阴性代表没病,在这个二分类问题中,我们首先关心的是,如何把所有阳性的病例筛出来,这是一个positive test问题,反之,如果我们关注的是阴性结果,就称为negative test。
有一种可能的错误就是误把健康人诊断为阳性,一个错误的阳性结果,就被称为假阳性FP,反之,错误的阴性结果称为假阴性FN。假阳性通常有被称为第一类错误(type I error), 假阴性称为第二类错误(type II error)。
非均匀数据集
错误类型的概念适用于那种一类数据非常常见,但是另一类数据非常罕见的情况。以疾病诊断为例,大多数检查的结果都是健康的,少数可能是患病的。或者网页广告推荐(或头条推送),通过记录用户的浏览情况给用户推荐内容,期待的结果是用户的点击行为,每个数据点展示的广告,标签/目标是用户是否发生了点击这个行为。 大多数广告都被“视而不见”了,只有少数广告会被点击,也就是说,点击这个标签的数据是非常少的,大多数,甚至可能是99%的标签都是不点击。在这种情况下,如果模型的预测全部都是“不点击”, 也可以得到99%的正确率,但这显然是由于数据本身的偏侧化造成的,这时候用正确率(accuracy)评价模型的性能也是不科学的。
我们来人为地模拟一个偏侧化的数据集,假设我们仅仅关心手写数字识别问题中对数字9的识别率(对应表现1),其他数字是否识别不关心(对应标签0)
import numpy as np
from sklearn.datasets import load_digits
from sklearn.model_selection import train_test_split
digits = load_digits()
y = digits.target == 9
X_train, X_test, y_train, y_test = train_test_split(
digits.data, y, random_state=0)
from sklearn.dummy import DummyClassifier
dummy_majority = DummyClassifier(strategy='most_frequent').fit(X_train, y_train)
pred_most_frequent = dummy_majority.predict(X_test)
print("Unique predicted labels: {}".format(np.unique(pred_most_frequent)))
print("Test score: {:.2f}".format(dummy_majority.score(X_test, y_test)))
Unique predicted labels: [False]
Test score: 0.90
正如预料的那样,由于数据集本身的不均衡性,即便是DummyClassifier也可以得到90%的正确率。如果用一个真实的机器学习模型,以决策树为例:
from sklearn.tree import DecisionTreeClassifier
tree = DecisionTreeClassifier(max_depth=2).fit(X_train, y_train)
pred_tree = tree.predict(X_test)
print('Test score: {:.2f}'.format(tree.score(X_test, y_test)))
Test score: 0.92
这里决策树给出的正确率并不比DummyClassifer高多少。换成LogisitcRegression模型,可以看到如果将DummyClassifier的strategy设置为默认,表现明显下降,同时LogisticRegression给出了非常好的结果。
from sklearn.linear_model import LogisticRegression
dummy = DummyClassifier().fit(X_train, y_train)
#pred_dumy = dummy.predict(X_test)
print('dummy score: {:.2f}'.format(dummy.score(X_test,y_test)))
logreg = LogisticRegression(C=0.1).fit(X_train, y_train)
pred_logreg = logreg.predict(X_test)
print('logreg score: {:.2f}'.format(logreg.score(X_test, y_test)))
dummy score: 0.83
logreg score: 0.98
事实上,在非常不均衡的数据集上正确率却是不是一个很好的指标。
混淆矩阵、正确率、精确率、召回率和f-score
二分类问题中,混淆矩阵是一个非常好的模型评估工具。
from sklearn.metrics import confusion_matrix
confusion = confusion_matrix(y_test, pred_logreg)
print("Confusion matrix:\n{}".format(confusion))
Confusion matrix:
[[401 2]
[ 8 39]]
混淆矩阵是一个两行两列的方阵, 行对应的是真实的分类,列对应的是预测的分类。也就是:
[TN FP
FN TP]
这里:
401就是实际上不是9,预测也不是9的样本个数
2就是实际上不是9,预测是9的样本个数
8就是实际上是9,但是预测不是9的样本个数
39是实际上是9,预测也是9的样本个数。
从混淆矩阵出发,再来看看正确率accuracy:
Accuracy被定义为预测正确的个数,其中包括了实际上是9预测是9的(TP)以及实际上不是9,预测也不是9的(TN)在所有样本中的占比,写为公式是:
A c c u r a c y = T P + T N T P + T N + F P + F N Accuracy = \frac{TP+TN}{TP+TN+FP+FN} Accuracy=TP+TN+FP+FNTP+TN
Precision,精确度,是指所有positive的样本中有多少被正确地识别,precision也被称为阳性预测值(positive predictive value,PPV)
P r e c i s i o n = T P T P + F P Precision = \frac{TP}{TP+FP} Precision=TP+FPTP
Recall,召回率,是衡量对所有positive样本的辨别程度,或者说,是在所有判断为positive的样本中,有多少为真。recall也被称为灵敏度、点击率或者真阳性率。
R e c a l l = T P T P + F N Recall = \frac{TP}{TP+FN} Recall=TP+FNTP
在优化recall和precision之间必须要做个折中,如果将所有的样本都判别为真,就会引入很多的假阳性,从而Presition就必然很低,但是如果模型非常保守,只将最有可能为真的样本判断为真,Precision会非常高,但是Recall就很低了。
除此之外,还有f-score,是precision和recall的调和平均数:
F = 2 p r e c i s i o n ∗ r e c a l l p r e c i s i o n + r e c a l l F = 2\frac{precision*recall}{precision+recall} F=2precision+recallprecision∗recall
scikit learn的metrics.classification_report可以直接计算precision, recall和 f1-score,例如:
from sklearn.metrics import classification_report
print(classification_report(y_test, pred_most_frequent,
                           target_names=["not nine", "nine"]))
print(classification_report(y_test, pred_logreg,
                           target_names=["not nine", "nine"]))
precision recall f1-score support
not nine 0.90 1.00 0.94 403
nine 0.00 0.00 0.00 47
avg / total 0.80 0.90 0.85 450
precision recall f1-score support
not nine 0.98 1.00 0.99 403
nine 0.95 0.83 0.89 47
avg / total 0.98 0.98 0.98 450
不知道标签均匀性的情况
有时候我们可能并不知道标签是否均匀,同时,模型内部对于目标函数和输出之间的处理也直接影响了但是在指定优化目标的同时,就已经损失了数据集合中的一些信息,这么说有些抽象,举个例子。
非均匀的二分类任务,400个点属于negative类,50个属于positive类,用rbf-kernel的SVM分类器分类后,得到classification_report. 这里较多的那一类标签为0, 较少的一类标签为1. 而且在这个问题中,我们关注的是模型判断为1的样本,实际上确实是1的这种情况,换句话说,就是模型的召回率。
from mglearn.datasets import make_blobs
X, y = make_blobs(n_samples=(400, 50),
                  centers=2,
                  cluster_std=[7.0, 2],
                 random_state=22)
X_train, X_test, y_train, y_test = train_test_split(X, y, random_state=0)
svc = SVC(gamma=0.5).fit(X_train, y_train)
print(classification_report(y_test, svc.predict(X_test)))
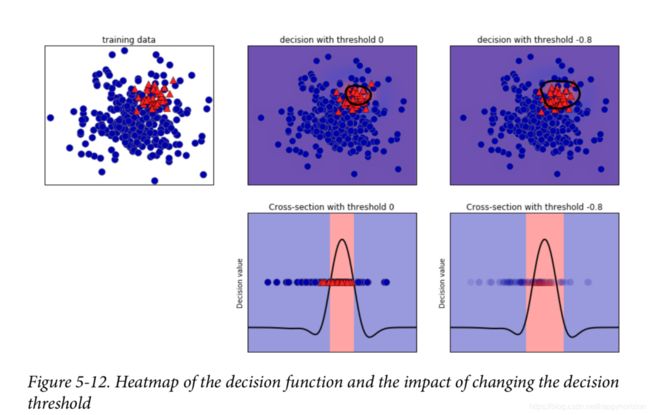
mglearn.plots.plot_decistion_threshold()
得到
在实际场景中这种情况比较常见,也就是我们模型需要特别关注的是二分类中比较少那一类,例如生产流水线质量检测,或者疾病检测,都是需要模型可以对少量的样本进行检测和识别。可以看出, 标签1的那一类召回率仅为0.67, 标签为0的略高,但是考虑到0这一类样本非常多,这个结果实际上差强人意。

由于我们希望1类的召回率尽可能高,也就是我们愿意冒一些假阳性的风险,换取更多的真阳性,使召回率高些。我们已知模型内部predict()函数将结果大于0的认为是0这一类,小于0是1,那么可以对svc.decision_function( ) 设置阈值调整模型预测的结果,例如:
y_pred_lower_threshold = svc.decision_function(X_test) > -0.8
也可以设置模型的predict_proba方法的阈值,通常0.5代表模型有50%的把握认为样本属于positive类,通过调整这个阈值,也可以适当地调节模型对结果的预测性能。
精度-召回曲线和ROC曲线
精度-召回曲线( precision-recall curve)
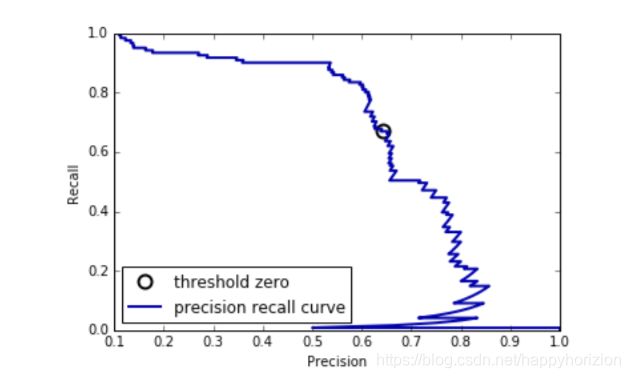
from sklearn.metrics import precision_recall_curve precision, recall, thresholds = precision_recall_curve(
        y_test, svc.decision_function(X_test))

# Use more data points for a smoother curve
    X, y = make_blobs(n_samples=(4000, 500), centers=2, cluster_std=[7.0, 2],
                      random_state=22)
    X_train, X_test, y_train, y_test = train_test_split(X, y, random_state=0)
    svc = SVC(gamma=.05).fit(X_train, y_train)
    precision, recall, thresholds = precision_recall_curve(
y_test, svc.decision_function(X_test))
# find threshold closest to zero
close_zero = np.argmin(np.abs(thresholds)) plt.plot(precision[close_zero], recall[close_zero], 'o', markersize=10,
             label="threshold zero", fillstyle="none", c='k', mew=2)
    plt.plot(precision, recall, label="precision recall curve")
    plt.xlabel("Precision")
    plt.ylabel("Recall")
ROC和AUC
ROC曲线(receiver operating characteristics curve, ROC)考虑了给定分类器在所有可能的阈值下的表现, 但是和精度-召回曲线不同,ROC曲线给出的是假阳性率(false positive rate, FPR)VS真阳性率(true positive rate, TPR),其中真阳性率的另一个名字就是召回率,假阳性率FPR就是在所有阴性的样本中模型判断为假阳性的比例, 公式为:
F P R = F P F P + T N FPR=\frac{FP}{FP+TN} FPR=FP+TNFP
ROC曲线可以用sklearn.metrics的roc_curve( )函数计算,例如:
from sklearn.metrics import roc_curve
fpr, tpr, thresholds = roc_curve(y_test, svc.decisition_function(X_test))
plt.plot(fpr, tpr, label='ROC_curve')
plt.xlabel('FPR')
plt.ylabel('TPR (recall)')
# find threshold closest to zero
close_zero = np.argmin(np.abs(thresholds))
plt.plot(fpr[close_zero], tpr[close_zero], 'o', markersize=10,
        label='threshold zero', fillstyle='none', c='k', mew=2
        )
plt.legend(loc=4)
对于ROC曲线,理想状态是越接近左侧顶部越好,也就是在召回率较高的同时保持一个比较低的FPR水平。
AUC, Area Under the Curve, 是ROC曲线下的面积, 下面的例子说明了AUC对于非均匀数据集分类问题的作用。
import numpy as np
from sklearn.datasets import load_digits
from sklearn.model_selection import train_test_split
from sklearn.svm import SVC
digits = load_digits()
y = digits.target == 9
X_train, X_test, y_train, y_test = train_test_split(
digits.data, y, random_state=0)
X_train, X_test, y_train, y_test = train_test_split(
digits.data, y, random_state=0
)
from sklearn.metrics import roc_auc_score
from sklearn.metrics import roc_curve
import matplotlib.pyplot as plt
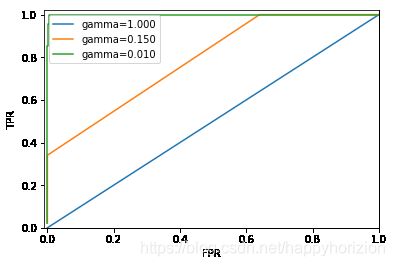
for gamma in [1, 0.15, 0.01]:
    svc = SVC(gamma=gamma).fit(X_train, y_train)
    accuracy = svc.score(X_test, y_test)
    auc = roc_auc_score(y_test, svc.decision_function(X_test))
    fpr, tpr, _ = roc_curve(y_test, svc.decision_function(X_test))
    print('gamma = {:.2f} accuracy = {:.2f}  AUC = {:.2f}'.format(
            gamma, accuracy, auc))
    plt.plot(fpr, tpr, label="gamma={:.3f}".format(gamma))
plt.xlabel("FPR")
plt.ylabel("TPR")
plt.xlim(-0.01,1)
plt.ylim(0, 1.02)
plt.legend(loc='best')
gamma = 1.00 accuracy = 0.90  AUC = 0.50
gamma = 0.15 accuracy = 0.90  AUC = 0.79
gamma = 0.01 accuracy = 0.90  AUC = 1.00
在这个例子中,gamma的取值变化时,accuracy没有变,始终都是90%,但是AUC指标大不相同。显然,对于非均匀数据,AUC是个更好的指标。

