基因表达聚类分析之初探SOM - 自组织特征图
之前的培训有老师提出要做SOM分析,最后卡在code plot只能出segment plot却出不来line plot。查了下,没看到解决方案。今天看了下源码,设置了一个参数,得到趋势图。也顺便学习了SOM分析的整个过程,整理下来,以备以后用到。
更多聚类相关见:
基因共表达聚类分析和可视化
聚类分析factoextra
获取pheatmap聚类后和标准化后的结果
WGCNA分析,简单全面的最新教程
一文学会网络分析——Co-occurrence网络图在R中的实现
SOM分析基本理论
SOM (Self-Organizing Feature Map,自组织特征图)是基于神经网络方式的数据矩阵和可视化方式。与其它类型的中心点聚类算法如K-means等相似,SOM也是找到一组中心点 (又称为codebook vector),然后根据最相似原则把数据集的每个对象映射到对应的中心点。在神经网络术语中,每个神经元对应于一个中心点。
与K-means类似,数据集中的每个对象每次处理一个,判断最近的中心点,然后更新中心点。与K-means不同的是,SOM中中心点之间存在拓扑形状顺序,在更新一个中心点的同时,邻近的中心点也会随着更新,直到达到设定的阈值或中心点不再有显著变化。最终获得一系列的中心点 (codes)隐式地定义多个簇,与这个中心点最近的对象归为同一个簇。
SOM强调簇中心点之间的邻近关系,相邻的簇之间相关性更强,更有利于解释结果,常用于可视化网络数据或基因表达数据。
Even though SOM is similar to K-means, there is a fundamental difference. Centroids used in SOM have a predetermined topographic ordering relationship. During the training process, SOM uses each data point to update the closest centroid and centroids that are nearby in the topographic ordering. In this way, SOM produces an ordered set of centroids for any given data set. In other words, the centroids that are close to each other in the SOM grid are more closely related to each other than to the centroids that are farther away. Because of this constraint, the centroids of a two-dimensional SOM can be viewed as lying on a two-dimensional surface that tries to fit the n-dimensional data as well as possible. The SOM centroids can also be thought of as the result of a nonlinear regression with respect to the data points. At a high level, clustering using the SOM technique consists of the steps described in Algorithm below:
1: Initialize the centroids.
2: repeat
3:     Select the next object.
4:     Determine the closest centroid to the object.
5:     Update this centroid and the centroids that are close, i.e., in a specified neighborhood.
6: until The centroids don't change much or a threshold is exceeded.
7: Assign each object to its closest centroid and return the centroids and clusters.
SOM分析实战
下面是R中用kohonen包进行基因表达数据的SOM分析。
加载或安装包
### LOAD LIBRARIES - install with:
#install.packages(c("kohonen")
library(kohonen)
读入数据并进行标准化
data <- read.table("ehbio_trans.Count_matrix.xls", row.names=1, header=T, sep="\t")

# now train the SOM using the Kohonen method
# 标准化数据
data_train_matrix <- as.matrix(t(scale(t(data))))
names(data_train_matrix) <- names(data)

head(data_train_matrix)
untrt_N61311 untrt_N052611 untrt_N080611 untrt_N061011 trt_N61311
ENSG00000223972    1.6201852    -0.5400617    -0.5400617    -0.5400617 -0.5400617
ENSG00000227232   -1.0711639     1.0274429     0.6776751     0.8525590 -1.2460478
ENSG00000278267   -1.6476479     1.3480756     0.1497862     0.7489309 -0.4493585
ENSG00000237613    2.4748737    -0.3535534    -0.3535534    -0.3535534 -0.3535534
ENSG00000238009   -0.3535534    -0.3535534    -0.3535534    -0.3535534  2.4748737
ENSG00000268903   -0.7020086     0.9025825    -0.7020086    -0.7020086 -0.7020086
trt_N052611 trt_N080611 trt_N061011
ENSG00000223972   1.6201852  -0.5400617  -0.5400617
ENSG00000227232  -1.2460478   0.5027912   0.5027912
ENSG00000278267   0.7489309   0.1497862  -1.0485032
ENSG00000237613  -0.3535534  -0.3535534  -0.3535534
ENSG00000238009  -0.3535534  -0.3535534  -0.3535534
ENSG00000268903   0.9025825  -0.7020086   1.7048781
训练SOM模型
# 定义网络的大小和形状
som_grid <- somgrid(xdim = 10, ydim=10, topo="hexagonal")

# Train the SOM model!
som_model <- supersom(data_train_matrix, grid=som_grid, keep.data = TRUE)
可视化SOM结果
# Plot of the training progress - how the node distances have stabilised over time.
# 展示训练过程,距离随着迭代减少的趋势,判断迭代是否足够;最后趋于平稳比较好
plot(som_model, type = "changes")
计量每个SOM中心点包含的基因的数目
## custom palette as per kohonen package (not compulsory)
coolBlueHotRed <- function(n, alpha = 0.7) {
  rainbow(n, end=4/6, alpha=alpha)[n:1]
}

# shows the number of objects mapped to the individual units.
# Empty units are depicted in gray.
plot(som_model, type = "counts", main="Node Counts", palette.name=coolBlueHotRed)
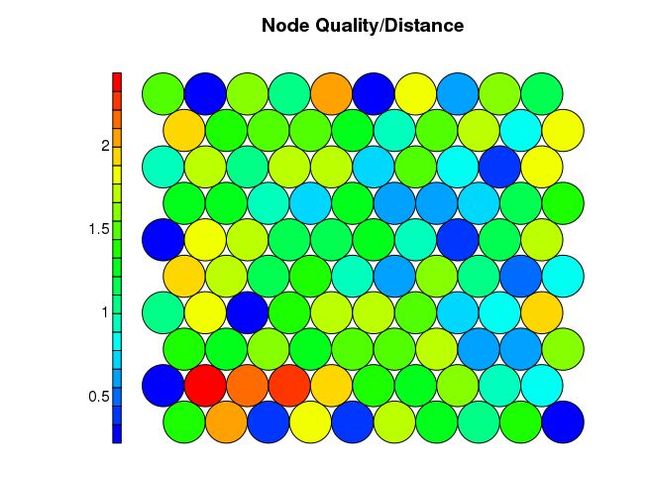
计量SOM中心点的内敛性和质量
# map quality
# shows the mean distance of objects mapped to a unit to
# the codebook vector of that unit.
# The smaller the distances, the better the objects are
# represented by the codebook vectors.
plot(som_model, type = "quality", main="Node Quality/Distance", palette.name=coolBlueHotRed)
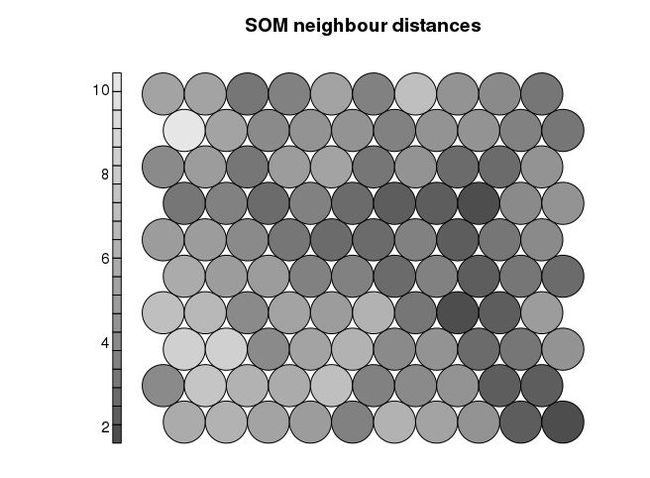
邻居距离-查看潜在边界点
# 颜色越深表示与周边点差别越大,越是分界点
# neighbour distances
# shows the sum of the distances to all immediate neighbours.
# This kind of visualization is also known as a U-matrix plot.
# Units near a class boundary can be expected to have higher average distances to their neighbours.
# Only available for the "som" and "supersom" maps, for the moment.
plot(som_model, type="dist.neighbours", main = "SOM neighbour distances", palette.name=grey.colors)
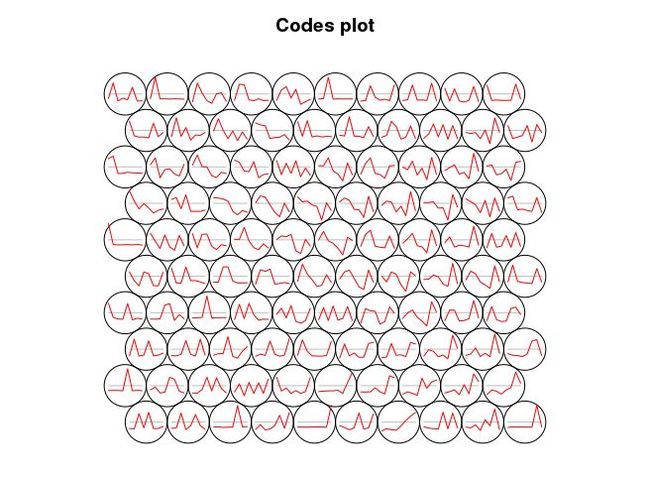
查看SOM中心点的变化趋势
#code spread
plot(som_model, type = "codes", codeRendering="lines")
获取每个SOM中心点相关的基因
table(som_model$unit.classif)
# 只显示一部分
  1   2   3   4   5   6
197 172 434 187 582 249
 95  96  97  98  99 100
168 919 226 419 193 241
# code是从左至右,从下至上进行编号的
som_model_code_class = data.frame(name=rownames(data_train_matrix), code_class=som_model$unit.classif)
head(som_model_code_class)
            name code_class
1 ENSG00000223972         81
2 ENSG00000227232         37
3 ENSG00000278267         93
4 ENSG00000237613         51
5 ENSG00000238009         11
6 ENSG00000268903          4
SOM结果进一步聚类
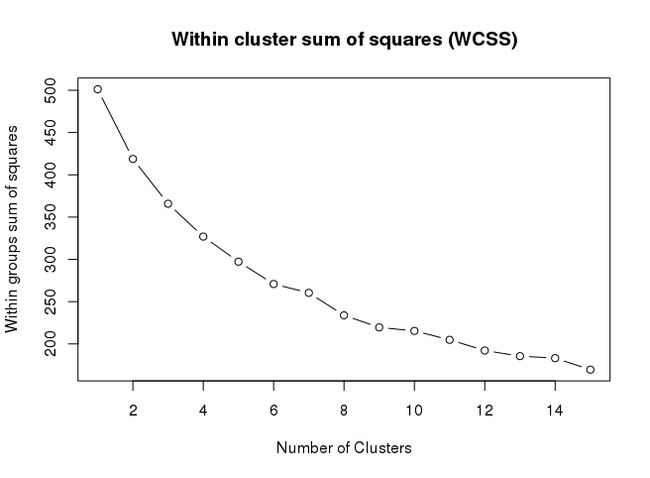
# 选择合适的聚类数目
# show the WCSS metric for kmeans for different clustering sizes.
# Can be used as a "rough" indicator of the ideal number of clusters
mydata <- as.matrix(as.data.frame(som_model$codes))
wss <- (nrow(mydata)-1)*sum(apply(mydata,2,var))
for (i in 2:15) wss[i] <- sum(kmeans(mydata, centers=i)$withinss)
par(mar=c(5.1,4.1,4.1,2.1))
plot(1:15, wss, type="b", xlab="Number of Clusters",
     ylab="Within groups sum of squares", main="Within cluster sum of squares (WCSS)")
# Form clusters on grid
## use hierarchical clustering to cluster the codebook vectors
som_cluster <- cutree(hclust(dist(mydata)), 6)
# Colour palette definition
cluster_palette <- function(x, alpha = 0.6) {
  n = length(unique(x)) * 2
  rainbow(n, start=2/6, end=6/6, alpha=alpha)[seq(n,0,-2)]
}

cluster_palette_init = cluster_palette(som_cluster)
bgcol = cluster_palette_init[som_cluster]

#show the same plot with the codes instead of just colours
plot(som_model, type="codes", bgcol = bgcol, main = "Clusters", codeRendering="lines")
add.cluster.boundaries(som_model, som_cluster)
SOM获取基因所在的新类
som_model_code_class_cluster = som_model_code_class
som_model_code_class_cluster$cluster = som_cluster[som_model_code_class$code_class]
head(som_model_code_class_cluster)
            name code_class cluster
1 ENSG00000223972         81       2
2 ENSG00000227232         37       8
3 ENSG00000278267         93       8
4 ENSG00000237613         51       7
5 ENSG00000238009         11       4
6 ENSG00000268903          4       3
映射某个属性到SOM图
# 此处选择一个样本作为示例,可以关联很多信息,
# 比如基因通路,只要在矩阵后增加新的属性就可以。
color_by_var = names(data_train_matrix)[1]
color_by = data_train_matrix[,color_by_var]
unit_colors <- aggregate(color_by, by=list(som_model$unit.classif), FUN=mean, simplify=TRUE)
plot(som_model, type = "property", property=unit_colors[,2], main=color_by_var, palette.name=coolBlueHotRed)
R统计和作图
Graphpad,经典绘图工具初学初探
维恩(Venn)图绘制工具大全 (在线+R包)
在R中赞扬下努力工作的你,奖励一份CheatShet
别人的电子书,你的电子书,都在bookdown
R语言 - 入门环境Rstudio
R语言 - 热图绘制 (heatmap)
R语言 - 基础概念和矩阵操作
R语言 - 热图简化
R语言 - 热图美化
R语言 - 线图绘制
R语言 - 线图一步法
R语言 - 箱线图(小提琴图、抖动图、区域散点图)
R语言 - 箱线图一步法
R语言 - 火山图
R语言 - 富集分析泡泡图
R语言 - 散点图绘制
R语言 - 韦恩图
R语言 - 柱状图
R语言 - 图形设置中英字体
R语言 - 非参数法生存分析
R语言 - 绘制seq logo图
WGCNA分析,简单全面的最新教程
psych +igraph:共表达网络构建
一文学会网络分析——Co-occurrence网络图在R中的实现
一文看懂PCA主成分分析
富集分析DotPlot,可以服
基因共表达聚类分析和可视化
R中1010个热图绘制方法
还在用PCA降维?快学学大牛最爱的t-SNE算法吧, 附Python/R代码
一个函数抓取代谢组学权威数据库HMDB的所有表格数据
文章用图的修改和排版
network3D: 交互式桑基图
network3D 交互式网络生成
Seq logo 在线绘制工具——Weblogo
生物AI插图素材获取和拼装指导
ggplot2高效实用指南 (可视化脚本、工具、套路、配色)
图像处理R包magick学习笔记
SOM基因表达聚类分析初探
利用gganimate可视化全球范围R-Ladies(R社区性别多样性组织)发展情况
一分钟绘制磷脂双分子层:AI零基础入门和基本图形绘制
AI科研绘图(二):模式图的基本画法
你知道R中的赋值符号箭头(<-)和等号(=)的区别吗?
R语言可视化学习笔记之ggridges包
利用ComplexHeatmap绘制热图(一)
ggplot2学习笔记之图形排列
R包reshape2,轻松实现长、宽数据表格转换
用R在地图上绘制网络图的三种方法
PCA主成分分析实战和可视化 附R代码和测试数据
iTOL快速绘制颜值最高的进化树!
12个ggplot2扩展包帮你实现更强大的可视化
编程模板-R语言脚本写作:最简单的统计与绘图,包安装、命令行参数解析、文件读取、表格和矢量图输出
R语言统计入门课程推荐——生物科学中的数据分析Data Analysis for the Life Sciences
数据可视化基本套路总结
你知道R中的赋值符号箭头
<-和等号=的区别吗?使用dplyr进行数据操作30例
交集intersect、并集union、找不同setdiff
R包reshape2,轻松实现长、宽数据表格转换
1数据类型(向量、数组、矩阵、 列表和数据框)
2读写数据所需的主要函数、与外部环境交互
3数据筛选——提取对象的子集
4向量、矩阵的数学运算
5控制结构
6函数及作用域
7认识循环函数lapply和sapply
8分解数据框split和查看对象str
9模拟—随机数、抽样、线性模型
1初识ggplot2绘制几何对象
2图层的使用—基础、加标签、注释
3工具箱—误差线、加权数、展示数据分布
4语法基础
5通过图层构建图像
6标度、轴和图例
7定位-分面和坐标系
8主题设置、存储导出
9绘图需要的数据整理技术
创建属于自己的调色板
28个实用绘图包,总有几个适合你
热图绘制
R做线性回归
绘图相关系数矩阵corrplot
相关矩阵可视化ggcorrplot
绘制交互式图形recharts
交互式可视化CanvasXpress
聚类分析factoextra
LDA分析、作图及添加置信-ggord
解决散点图样品标签重叠ggrepel
添加P值或显著性标记ggpubr
Alpha多样性稀释曲线rarefraction curve
堆叠柱状图各成分连线画法:突出组间变化
冲击图展示组间时间序列变化ggalluvial
桑基图riverplot
微生物环境因子分析ggvegan
五彩进化树与热图更配ggtree
多元回归树分析mvpart
随机森林randomForest 分类Classification 回归Regression
加权基因共表达网络分析WGCNA
circlize包绘制circos-plot
R语言搭建炫酷的线上博客系统
维恩(Venn)图绘制工具大全 (在线+R包)
R包circlize:柱状图用腻了?试试好看的弦状图
获取pheatmap聚类后和标准化后的结果
增强火山图,要不要试一下?
一个震撼的交互型3D可视化R包 - 可直接转ggplot2图为3D
赠你一只金色的眼 - 富集分析和表达数据可视化
是Excel的图,不!是R的图
道友,来Rstudio里面看动画了
用了这么多年的PCA可视化竟然是错的!!!
R语言可视化学习笔记之ggridges包
万能转换:R图和统计表转成发表级的Word、PPT、Excel、HTML、Latex、矢量图等
那天空飘过的梅花月饼,是今年最好的中秋礼物
高颜值免费在线绘图
![]()
往期精品
画图三字经 生信视频 生信系列教程
心得体会 TCGA数据库 Linux Python
高通量分析 免费在线画图 测序历史 超级增强子
生信学习视频 PPT EXCEL 文章写作 ggplot2
海哥组学 可视化套路 基因组浏览器
色彩搭配 图形排版 互作网络
自学生信 2019影响因子 GSEA 单细胞
后台回复“生信宝典福利第一波”或点击阅读原文获取教程合集
![]()
![]()


