【数据聚类】第三章第三节2:类K-Means算法之K-中值算法(K-medians)
文章目录
- 一:算法思想
- 二:算法流程
- 三:Python实现
- 四:效果展示
- 五:与K-中心点算法区别
一:算法思想
K K K- M e d i a n s Medians Medians算法:该算法与 K K K- M e a n s Means Means的区别主要有
①: K K K- M e d i a n s Medians Medians算法采用计算每个簇中值的方法取代了 K K K- M e a n s Means Means算法中计算均值。相比于均值,中值受到离群点的干扰程度相对较小,所以 K K K- M e d i a n s Medians Medians算法的抗干扰能力要强于 K K K- M e a n s Means Means算法
②: K K K- M e d i a n s Medians Medians算法采用 L 1 L_{1} L1范数来计算距离,算法目标函数为
S = ∑ k = 1 K ∑ x i ∈ C k ∣ x i j − m e d k j ∣ S=\sum_{k=1}^{K}\sum_{x_{i}\in C_{k}}|x_{ij}-med_{kj}| S=k=1∑Kxi∈Ck∑∣xij−medkj∣
其中
-
x i j x_{ij} xij表示数据 x i x_{i} xi的第 j j j个属性
-
m e d k j med_{kj} medkj表示在第 k k k个簇中数据的第 j j j个属性的中值
③:算法的目标是最小化每个数据点与其所属簇中值点之间距离的和
二:算法流程
三:Python实现
import numpy as np
import random

def divide_cluster(data_set, centorids):
    data_set_nums = np.shape(data_set)[0]
    centorids_nums = np.shape(centorids)[0]
    cluster = np.zeros(data_set_nums)
    for data_set_point in range(data_set_nums):
        distance = np.zeros(centorids_nums)
        for centorids_point in range(centorids_nums):
            distance[centorids_point] = np.linalg.norm(data_set[data_set_point]-centorids[centorids_point], ord=1)  # L1范数
        cluster[data_set_point] = np.argmin(distance)
    return cluster

def renew_centorids(data_set, cluster, k):
    centorids = np.zeros((k, np.shape(data_set)[1]))
    for centorid_id in range(k):
        bool_array = cluster == centorid_id
        centorids[centorid_id] = np.median(data_set[bool_array.flatten(), :], axis=0)
    return centorids


def kmedians(data_set, k, max_iterations):
    # 随机选取k个初始的中心点
    data_index = list(range(len(data_set)))
    random.shuffle(data_index)
    init_centorids_index = data_index[:k]
    centorids = data_set[init_centorids_index, :]  # k个初始中心点
    cluster = np.zeros(np.shape(data_set)[0])  # 用于标识每个样本点属于哪一个簇

    for _ in range(max_iterations):
        # 计算距离实现划分
        cluster = divide_cluster(data_set, centorids)
        # 更新中心点
        centorids = renew_centorids(data_set, cluster, k)

    return centorids, cluster
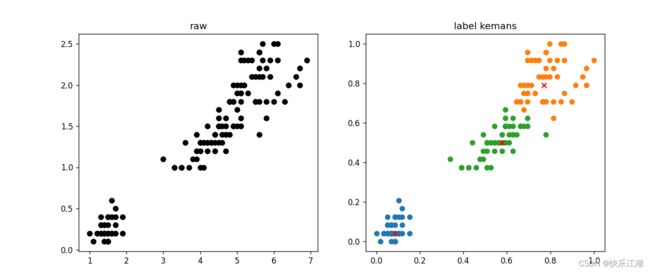
四:效果展示
import pandas as pd
import matplotlib.pyplot as plt
import KMedians
import numpy as np

Iris_types = ['Iris-setosa', 'Iris-versicolor', 'Iris-virginica']  # 花类型
Iris_data = pd.read_csv('dataSet/Iris.csv')
x_axis = 'PetalLengthCm'  # 花瓣长度
y_axis = 'PetalWidthCm'   # 花瓣宽度
# x_axis = 'SepalLengthCm'  # 花萼长度
# y_axis = 'SepalWidthCm'  # 花萼宽度

examples_num = Iris_data.shape[0]  # 样本数量
train_data = Iris_data[[x_axis, y_axis]].values.reshape(examples_num, 2)  # 整理数据

# 归一化
min_vals = train_data.min(0)
max_vals = train_data.max(0)
ranges = max_vals - min_vals
normal_data = np.zeros(np.shape(train_data))
nums = train_data.shape[0]
normal_data = train_data - np.tile(min_vals, (nums, 1))
normal_data = normal_data / np.tile(ranges, (nums, 1))

#  训练参数
k = 3  # 簇数
max_iterations = 50  # 最大迭代次数
centroids, cluster = KMedians.kmedians(normal_data, k, max_iterations)


plt.figure(figsize=(12, 5), dpi=80)

#  第一幅图是已知标签或全部数据
plt.subplot(1, 2, 1)

for Iris_type in Iris_types:
        plt.scatter(Iris_data[x_axis], Iris_data[y_axis], c='black')
plt.title('raw')

# 第二幅图是聚类结果
plt.subplot(1, 2, 2)
for centroid_id, centroid in enumerate(centroids):  # 非聚类中心
    current_examples_index = (cluster == centroid_id).flatten()
    plt.scatter(normal_data[current_examples_index, 0], normal_data[current_examples_index, 1])

for centroid_id, centroid in enumerate(centroids):  # 聚类中心
    plt.scatter(centroid[0], centroid[1], c='red', marker='x')
plt.title('label kemans')
plt.show()
五:与K-中心点算法区别
K-中值算法与K-中心点算法常常会搞混,因为这两种算法都是以增强标准K-均值算法的抗干扰能力为目标所提出的改进算法,区别在于
- K-中心点算法所选取的中心点只能是实际的数据点
- K-中值算法所选取的中心点很可能是一个虚拟的点

