机器学习--监督学习 —— 回归模型
这里写目录标题
-
-
-
- 监督学习 —— 回归模型
-
- 线性回归模型
- 线性回归模型
- 最小二乘法
- 求解线性回归
-
- 单线性回归 (最小二乘法)
- 多元线性回归
- 梯度下降法求解线性回归
-
- 简单线性回归(梯度下降法)
- 线性回归调sklearn库实现
- **回归分析**泰迪云
-
-
- 线性回归
- 波士顿房价数据集(Boston House Price Dataset)
- 逻辑回归
- 代码实现逻辑回归
-
-
-
监督学习 —— 回归模型
●线性回归模型
– 一元线性回归
– 多元线性回归
●非线性回归模型
●最小二乘法
线性回归模型
●线性回归(linear regression)是一种线性模型, 它假设输入变量x
和单个输出变量y之间存在线性关系
●具体来说,利用线性回归模型,可以从一组输入变量x的线性组合中,
计算输出变量y
线性方程求解
假设我们有一-个如下的二元一次方程:
y=ax+b
我们已知两组数据: x=1时, y=3,即(1, 3)
x=2时,y=5,即(2, 5)
将数据输入方程中,可得:
a+b=3
2a+b=5
解得:
a=2,b= 1
即方程为:
2x+ 1=y
当我们有任意一-个x时, 输入方程,就可以得到对应的y
例如x=5时,y= 11。
线性回归模型
●给定有d个属性(特征) 描述的示例x= (x1;x2;…;xd) ,其中xi是x在第i个属性(特征)上的取值,线性模型(linear model)试图学得一个通过
属性(特征)的线性组合来进行预测的函数,即:
![]()
一般用向量形式写成:

● 假设特征和结果都满足线性,即不大于一-次方。
●w和b学得之后, 模型就得以确定。
●许多功能更为强大的非线性模型可在线性模型的基础上通过引入层级结构或高维映射而得。
最小二乘法
●基于均方误差最小化来进行模型求解的方法称为‘ 最小二乘法”(least square method)
●它的主要思想就是选择未知参数,使得理论值与观测值之差的平方和达到最小。
●在线性回归中,最小二乘法就是试图找到一条直线,使所有样本到直线上的欧式距离之和最小。
求解线性回归
单线性回归 (最小二乘法)
在 jupyter notebook 运行代码
1、引入依赖
In [8]:
import numpy as np
import matplotlib.pyplot as plt
- 导入数据(data.csv)
points = np.genfromtxt('data.csv', delimiter=',') #delimiter :分隔符
points#全部数据
In [22]:
points = np.genfromtxt('data.csv', delimiter=',')

points[0,0]

# 提取points中的两列数据,分别作为x,y。数据式二维数组,两个中括号,: 代表第一括号里得全部数据,0代表左边数据 即X,1 即Y
x = points[:, 0]
y = points[:, 1]

# 用plt画出散点图
plt.scatter(x, y)
plt.show()
- 定义损失函数
# 损失函数是系数的函数,另外还要传入数据的x,y
def compute_cost(w, b, points):
    total_cost = 0
    M = len(points)  #样本得个数

    # 逐点计算平方损失误差,然后求平均数
    for i in range(M):
        x = points[i, 0]
        y = points[i, 1]
        total_cost += ( y - w * x - b ) ** 2

    return total_cost/M
In [24]:
# 先定义一个求均值的函数
def average(data):
    sum = 0
    num = len(data)
    for i in range(num):
        sum += data[i]
    return sum/num

# 定义核心拟合函数
def fit(points):
    M = len(points)
    x_bar = average(points[:, 0])#调用avergae方法 求x的均值

    sum_yx = 0  # 求w 公式中的分母
    sum_x2 = 0  #求w 公式中的分子的 x平方的求和
    sum_delta = 0

    for i in range(M):
        x = points[i, 0]
        y = points[i, 1]
        sum_yx += y * ( x - x_bar )
        sum_x2 += x ** 2
    # 根据公式计算w
    w = sum_yx / ( sum_x2 - M * (x_bar**2) )

    for i in range(M):
        x = points[i, 0]
        y = points[i, 1]
        sum_delta += ( y - w * x )
    b = sum_delta / M

    return w, b
- 测试
In [25]:
w, b = fit(points) #调用 fit 求得w,b

print("w is: ", w)
print("b is: ", b)

cost = compute_cost(w, b, points)  #调用上面损失函数,查看损失值
print("cost is: ", cost)
- 画出拟合曲线
In [26]:
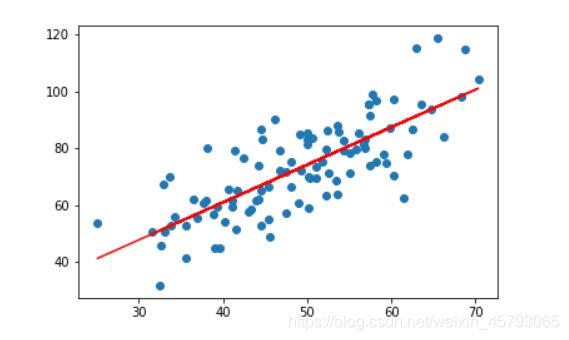
plt.scatter(x, y) #scatter 散点画
# 针对每一个x,计算出预测的y值
pred_y = w * x + b

plt.plot(x, pred_y, c='r')  #plot点图画,c 代表颜色
plt.show()
完整代码
1. 引入依赖
import numpy as np
import matplotlib.pyplot as plt

2. 导入数据(data.csv)
points = np.genfromtxt('data.csv', delimiter=',')
points[0,0]
# 提取points中的两列数据,分别作为x,y
x = points[:, 0]
y = points[:, 1]
# 用plt画出散点图
plt.scatter(x, y)
plt.show()

3、定义损失函数
# 损失函数是系数的函数,另外还要传入数据的x,y
def compute_cost(w, b, points):
    total_cost = 0
    M = len(points)

    # 逐点计算平方损失误差,然后求平均数
    for i in range(M):
        x = points[i, 0]
        y = points[i, 1]
        total_cost += ( y - w * x - b ) ** 2

    return total_cost/M
 4、定义算法拟合函数
# 先定义一个求均值的函数
def average(data):
    sum = 0
    num = len(data)
    for i in range(num):
        sum += data[i]
    return sum/num

# 定义核心拟合函数
def fit(points):
    M = len(points)
    x_bar = average(points[:, 0])

    sum_yx = 0
    sum_x2 = 0
    sum_delta = 0

    for i in range(M):
        x = points[i, 0]
        y = points[i, 1]
        sum_yx += y * ( x - x_bar )
        sum_x2 += x ** 2
    # 根据公式计算w
    w = sum_yx / ( sum_x2 - M * (x_bar**2) )

    for i in range(M):
        x = points[i, 0]
        y = points[i, 1]
        sum_delta += ( y - w * x )
    b = sum_delta / M

    return w, b
5、 测试
w, b = fit(points)

print("w is: ", w)
print("b is: ", b)

cost = compute_cost(w, b, points)

print("cost is: ", cost)
6、画出拟合曲线
plt.scatter(x, y)
# 针对每一个x,计算出预测的y值
pred_y = w * x + b

plt.plot(x, pred_y, c='r')
plt.show()
多元线性回归
如果有两个或两个以上的自变量,这样的线性回归分析就称为多元线
性回归
实际问题中,一-个现象往往是受多个因素影响的,所以多元线性回归
比一元线性回归的实际应用更广
梯度下降法求解线性回归
•a在梯度下降算法中被称作为学习率或者步长
•这意味着我们可以通过a来控制每-步走的距离,以保证不要走太快,错过了最低点;同时也要保证收敛速度不要太慢
•所以a的选择在梯度下降法中往往是很重要的,不能太大也不能太小
简单线性回归(梯度下降法)
- 引入依赖
In [2]:
import numpy as np
import matplotlib.pyplot as plt
- 导入数据(data.csv)
In [3]:
points = np.genfromtxt('data.csv', delimiter=',')

points[0,0]

# 提取points中的两列数据,分别作为x,y
x = points[:, 0]
y = points[:, 1]

# 用plt画出散点图
plt.scatter(x, y)
plt.show()
- 定义损失函数
In [4]:
# 损失函数是系数的函数,另外还要传入数据的x,y
def compute_cost(w, b, points):
    total_cost = 0
    M = len(points)

    # 逐点计算平方损失误差,然后求平均数
    for i in range(M):
        x = points[i, 0]
        y = points[i, 1]
        total_cost += ( y - w * x - b ) ** 2

    return total_cost/M
- 定义模型的超参数
In [5]:
alpha = 0.0001 #步长
initial_w = 0  #初始值
initial_b = 0   #初始值
num_iter = 10  #迭代次数
- 定义核心梯度下降算法函数
In [6]:
def grad_desc(points, initial_w, initial_b, alpha, num_iter):
    w = initial_w
    b = initial_b
    # 定义一个list保存所有的每次迭代的损失函数值,用来显示下降的过程
    cost_list = []

    for i in range(num_iter):
        cost_list.append( compute_cost(w, b, points) ) #调用损失函数,求得值放在cost_list列表中
        w, b = step_grad_desc( w, b, alpha, points )#每一步梯度下降,算梯度需要传入x y

    return [w, b, cost_list]

def step_grad_desc( current_w, current_b, alpha, points ): #w,b不再是initial_w和initial_b,是当前得w ,b
    sum_grad_w = 0
    sum_grad_b = 0
    M = len(points)

    # 对每个点,代入公式求和
    for i in range(M):
        x = points[i, 0]
        y = points[i, 1]
        sum_grad_w += ( current_w * x + current_b - y ) * x
        sum_grad_b += current_w * x + current_b - y

    # 用公式求当前梯度
    grad_w = 2/M * sum_grad_w
    grad_b = 2/M * sum_grad_b

    # 梯度下降,更新当前的w和b
    updated_w = current_w - alpha * grad_w
    updated_b = current_b - alpha * grad_b

    return updated_w, updated_b
- 测试:运行梯度下降算法计算最优的w和b
In [9]:
w, b, cost_list = grad_desc( points, initial_w, initial_b, alpha, num_iter )

print("w is: ", w)
print("b is: ", b)

cost = compute_cost(w, b, points)

print("cost is: ", cost)

plt.plot(cost_list)
plt.show()
w is:  1.4774173755483797
b is:  0.02963934787473238
cost is:  112.65585181499748
In [10]:
plt.scatter(x, y)
# 针对每一个x,计算出预测的y值
pred_y = w * x + b

plt.plot(x, pred_y, c='r')
plt.show()
线性回归调sklearn库实现
In [2]:
import numpy as npimport matplotlib.pyplot as plt
points = np.genfromtxt('data.csv', delimiter=',')

points[0,0]

# 提取points中的两列数据,分别作为x,y
x = points[:, 0]
y = points[:, 1]

# 用plt画出散点图
plt.scatter(x, y)
plt.show()
In [3]:
# 损失函数是系数的函数,另外还要传入数据的x,y
def compute_cost(w, b, points):
    total_cost = 0
    M = len(points)

    # 逐点计算平方损失误差,然后求平均数
    for i in range(M):
        x = points[i, 0]
        y = points[i, 1]
        total_cost += ( y - w * x - b ) ** 2

    return total_cost/M
In [7]:
from sklearn.linear_model import LinearRegression
lr = LinearRegression()

x_new = x.reshape(-1, 1)
y_new = y.reshape(-1, 1)
lr.fit(x_new, y_new)
Out[7]:
LinearRegression(copy_X=True, fit_intercept=True, n_jobs=None,
         normalize=False)
In [10]:
# 从训练好的模型中提取系数和截距
w = lr.coef_[0][0]
b = lr.intercept_[0]

print("w is: ", w)
print("b is: ", b)

cost = compute_cost(w, b, points)

print("cost is: ", cost)
w is:  1.3224310227553597
b is:  7.991020982270399
cost is:  110.25738346621318
In [11]:
plt.scatter(x, y)
# 针对每一个x,计算出预测的y值
pred_y = w * x + b

plt.plot(x, pred_y, c='r')
plt.show()
回归分析泰迪云
线性回归
sklearn.linear model中的LinearRegression可实现线性回归
LinearRegression的构造方法:
●LinearRegression(
fit. intercept-True, #默认值为True,表示计算随机变量,False 表示不计算随机变量
normalize= False, #默认值为False,表示在回归前是否对回因子X进行归化True 表示是,
copy X=True
LinearRegression的常用方法有:
●decision function(X) #返回X的预测值y
●fit(X,yLn jobsl) #拟合模型
●get params([deep]) #获取LinearRegression构造方法的参数信息
●predict(X) #求预测值#同decision function
案例:LinearRegression将方程分为两个部分存放,coef_存放回归系数,intercept_则存放截距
使用Python实现下面输入与输出的线性回归
输入: [[0, 0],[1, 1], [2, 2]]
两个输入
输出: [0, 1,2]
预测: [3, 3]
from sklearn.linear_model import LinearRegression
clf=LinearRegression()
clf.fit([[0, 0], [1, 1], [2, 2]], [0, 1, 2])  # 模型训练 自变量和因变量 x和y


#学习得到模型
#y = 0.5*x1 + 0.5*x2
#简单说:通过上面的x1,x2,y的到方程,再算出x1=3,x2=3的y是多少

pre = clf.predict([[3, 3]])   # 模型预测

clf.coef_ #系数
clf.intercept_#截距
print(pre)
print(clf.coef_)
print(clf.intercept_)
[3.]  y的结果
[0.5 0.5]  系数
2.220446049250313e-16  截距
波士顿房价数据集(Boston House Price Dataset)
数据说明
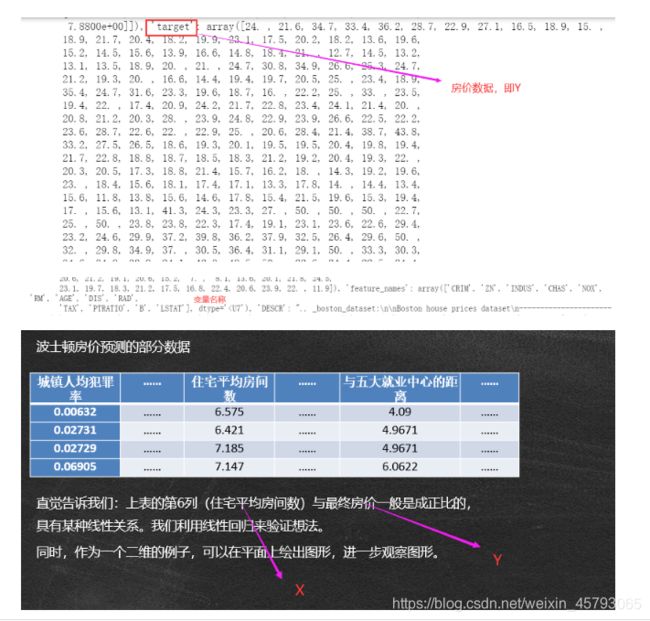
●波士顿房价数据集(Boston House Price Dataset)包含对房价的预测,
以千美元计,给定的条件是房屋及其相邻房屋的详细信息。
●该数据集是一个回归问题。每个类的观察值数量是均等的,共有506个观
察,13个输入变量和1个输出变量。 即13个x,一个y
●sklearn库的datasets包含该数据集( load boston)
变量名说明:
●CRIM:城镇人均犯罪率。
●TAX:每10000美元的全值财产税率。
●ZN:住宅用地超过25000 sg.ft. 的比例。PTRATIO: 城镇师生比例。
●INDUS城镇非零售商用+地的比例。
●B: 1000 (Bk-0.63) ^ 2,其中Bk指代城镇中黑人的比例。
●CHAS:查理斯河空变量(如果边界是河流,则为1;否则为0)。
●LSTAT:人口中地位低下者的比例。
●NOX:一氧化氮浓度。
●MEDV:自住房的平均房价,以千美元计。
●RM:住宅平均房间数。
●AGE: 1940年之前建成的自用房屋比例。
●DIS:到波土顿五个中心区域的加权距离。
●RAD:辐射性公路的接近指数。
from sklearn.datasets import load_boston #导入数据
from sklearn.linear_model import LinearRegression  #导入线性回归
import matplotlib.pyplot as plt  # 绘制拟合曲线
bosten = load_boston()  # 实例化,加载数据
x = bosten.data[:, 5:6]
print(bosten)
from sklearn.datasets import load_boston #导入数据
from sklearn.linear_model import LinearRegression  #导入线性回归模型
import matplotlib.pyplot as plt  # 绘制拟合曲线

clf = LinearRegression()
bosten = load_boston()  # 实例化,加载数据
x = bosten.data[:,5:6]  #住宅平均房间数 即x ,[:,6]是二维结构,[:,5:6]是二维
y=bosten.target#房价
clf.fit(x,y)# 模型训练
clf.coef_   # 回归系数
clf.intercept_#截距
y_pre = clf.predict(x)   # 模型输出值,简单说 通过模型训练得到y=clf.coef_ *x+clf.intercept_函数,再放x计算出y
plt.scatter(x, bosten.target)  # 样本实际分布 ,scatter 画散点图
plt.plot(x, y_pre, color='red')   # 绘制拟合曲线 ,plot点画图
plt.show()
逻辑回归
●分类和回归二者不存在不可逾越的鸿沟。就波土顿房价预测作为例子:如果将
房价按高低分为"高级” 、“中级” 和"普通”三个档次,那么这个预测问题
也属于分类问题。
●准确地说,逻辑回归(L ogistic Regression)是对数几率回归,属于广义线性
模型(GLM),它的因变量般只有0或1.
●需要明确件事情:线性回归并没有对数据的分布进行任何假设,而逻辑回归
隐含了一个基本假设:每个样本均独立服从于伯努利分布(0-1分布) 。
●伯努利分布属于指数分布族,这个大家庭还包括:高斯(正态)分布、多项式
分布、泊松分布、伽马分布、Dirichlet分布等。
对数几率回归/逻辑回归(logistic regression)
目标函数求解方法:梯度下降法、牛顿法
model = LogisticRegression(max iter = 500, solver =' newton-cg").fit(tr in.tr out)
model res = model,predict(te in)
代码实现逻辑回归
1、数据说明
通过分析不同的因素对研究生录取的影响来预测一个人是否会被录取。
数据的格式如下:

admit :表示是否被录取(目标变量)
gre;标准入学考试成绩,预测变量
gpa:学业平均绩点,预测变量
rank:母校排名(预测变量)
2、数据集划分
sklearn. model_selection随机划分训练集和测试集
train_test _split是交叉验证中常用的函数,功能是从样本中随机的按比例选取
train data和test data,形式为:
X_train.X_test, y_train, y_test= •cross_validation.train_test_split(train_data,train_target,test_size=0.4, random_state=0)
3、train_test_split参数解释:
•train_data:所要划分的样<u>*本特征集*</u>,即x

•train_target:所要划分的*<u>样本结果</u>*,即y

•test_size:样本占比,如果是整数的话就是样本的数量

•random_state:是随机数的种子。

•随机数种子:其实就是该组随机数的编号,在需要重复试验的时候,保证得到一组一样的随机数。比如你每次都填1,其他参数一样的情况下你得到的随机数组是一样的。但填0或不填,每次都会不一样。

•随机数的产生取决于种子,随机数和种子之间的关系遵从以下两个规则:

•种子不同,产生不同的随机数;种子相同,即使实例不同也产生相同的随机数。
4、在入门时建议首先掌握scikit-learn中的逻辑回归实现算法。
算法实现代码如下:
•import pandas as pd

•from sklearn.linear_model import LogisticRegression

•from sklearn.model_selection import train_test_split

•# 导入数据并观察

•data = pd.read_csv('LogisticRegression.csv')

•print(data.tail(5))  # 查看数据框的最后五行

•# 切分训练集和测试集

•X_train,X_test,y_train,y_test = train_test_split(data.iloc[:, 1:],data.iloc[:,0],test_size=.1,random_state=5)

•lr = LogisticRegression()  # 建立LR模型

•lr.fit(X_train,y_train)  # 用处理好的数据训练模型

•print('逻辑回归的准确率为:{0:.2f}%'.format(lr.score(X_test, y_test)*100))
实现步骤
导入数据
import pandas as pd
from sklearn.linear_model import LogisticRegression  #逻辑回归
from sklearn.model_selection import train_test_split #数据拆分函数
from sklearn.metrics import classification_report#分类报告

data = pd.read_csv('LogisticRegression.csv') #读取数据

#80%训练集,20%测试集
data_tr, data_te, label_tr, label_te = train_test_split(data.iloc[:, 1:], data['admit'], test_size=0.2) #放数据自变量和因变量

clf = LogisticRegression()
clf.fit(data_tr,label_tr) #传入x,y  模型训练
pre = clf.predict(data_te)  #通过clf.fit 求出函数,再把测试x代入算出,预测试y
res = classification_report(label_te, pre) #分类报告
print(res)
结果
 precision    recall  f1-score   support

           0       0.63      0.88      0.73        50
           1       0.40      0.13      0.20        30

    accuracy                           0.60        80
   macro avg       0.51      0.51      0.47        80
weighted avg       0.54      0.60      0.53        80


