Waymo自动驾驶数据集介绍与使用教程
本文将对Waymo自动驾驶数据集(Waymo Open Dataset)进行介绍。
论文链接为:https://arxiv.org/abs/1912.04838v7
项目链接为:https://github.com/waymo-research/waymo-open-dataset
数据集链接为:https://waymo.com/open
1. 自动驾驶感知可扩展性:Waymo开放数据集
这里首先对论文进行解读。
1.1 Abstract
整个数据集包含1150个场景,每个场景时长为20秒,且LiDAR和Camera是经过同步和标定处理过的。 对图像和激光雷达的bounding box进行了仔细的标注,并在各帧之间使用了一致的标识符。
1.2 Introduction
整个数据集包含约1200万个LiDAR注释框和约1200万个图像注释框,从而产生了约113k个LiDAR物体轨迹和约25万个图像轨迹。整个数据集划分为1000个训练集和150个测试集。
1.3 Waymo Open Dataset
- 1)Sensor Specifications
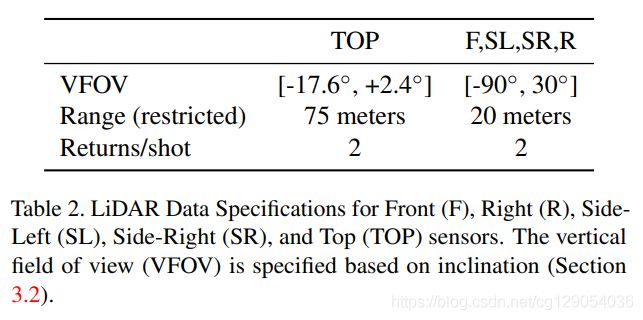
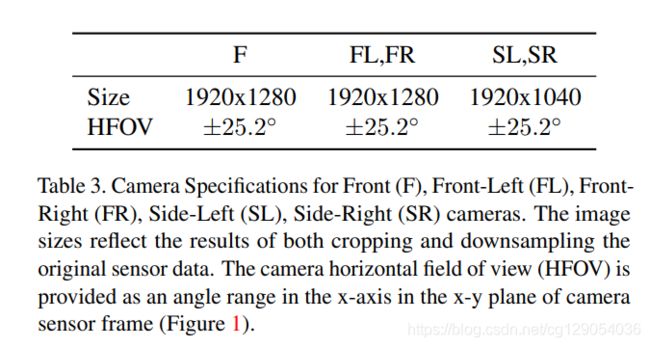
数据收集使用五个LiDAR和五个高分辨率针孔相机完成。 限制了LiDAR数据范围,并且每个激光脉冲有两个回波(双回波)。相机图像是通过卷帘快门扫描捕获的,其中确切的扫描模式可能因场景而异。 所有相机图像都将进行降采样并从原始图像中裁剪出来。
下图和表格是传感器安装布置图和规格介绍。
 |
 |
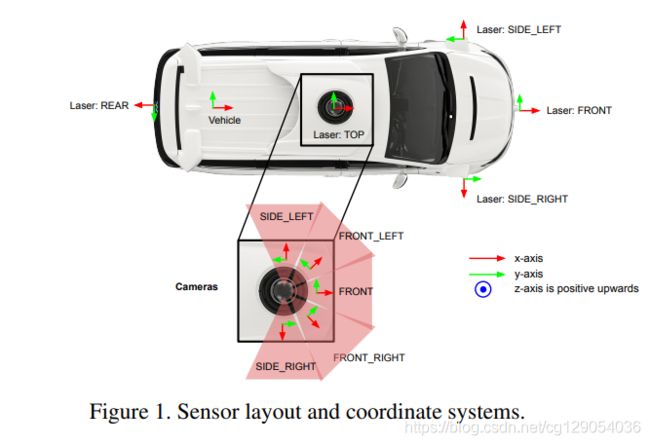
- 2)Coordinate Systems
整个数据集坐标系统遵守右手法则。全局坐标系为ENU坐标:Up(z)轴与重力方向一直,向上为正;East(x)沿着纬度指向正东,North(y)指向北极。车辆坐标系随汽车移动,x轴指向前方,y轴指向左侧,z轴向上为正。传感器坐标可以通过旋转矩阵从车辆坐标获得,可以把这看作是外参矩阵。
图像坐标是二维坐标,x轴表示图像宽度,y轴表示图像高度,图像左上角为坐标原点。激光雷达得到的点的坐标可以表示为 ( x , y , z ) (x,y,z) (x,y,z),转换成距离,方位角,倾角公式为:
range = x 2 + y 2 + z 2 azimuth = atan 2 ( y , x ) inclination = atan 2 ( z , x 2 + y 2 ) \begin{aligned}\text { range } &=\sqrt{x^{2}+y^{2}+z^{2}} \\\text { azimuth } &=\operatorname{atan} 2(y, x) \\\text { inclination } &=\operatorname{atan} 2\left(z, \sqrt{x^{2}+y^{2}}\right) \end{aligned} range azimuth inclination =x2+y2+z2=atan2(y,x)=atan2(z,x2+y2)
- 3)Ground Truth Labels
数据集中对汽车、行人、交通标志、自行车人员进行了详细标注。对于激光雷达数据,将每一个物体标注为7自由度3D bbox: ( c x , c y , c z , l , w , h , θ ) (cx,cy,cz,l,w,h,\theta) (cx,cy,cz,l,w,h,θ)。其中 c x , c y , c z cx,cy,cz cx,cy,cz表示为bbox中心坐标, l , w , h l,w,h l,w,h表示为物体长宽高, θ \theta θ表示为物体偏航角,此外对于每一个物体还标注了一个唯一的追踪ID编号。
图像标注中将每一个物体标注为4自由度2D bbox: ( c x , c y , l , w ) (cx,cy,l,w) (cx,cy,l,w)。其中 c x , c y cx,cy cx,cy表示为bbox中心图像坐标, l l l表示为物体长度, w w w表示为物体宽度。
此外,还将标注物体划分为了两个难度:LEVEL_2为物体对应激光雷达点数少于5个,其余则划分为LEVEL_1。

- 4)Sensor Data
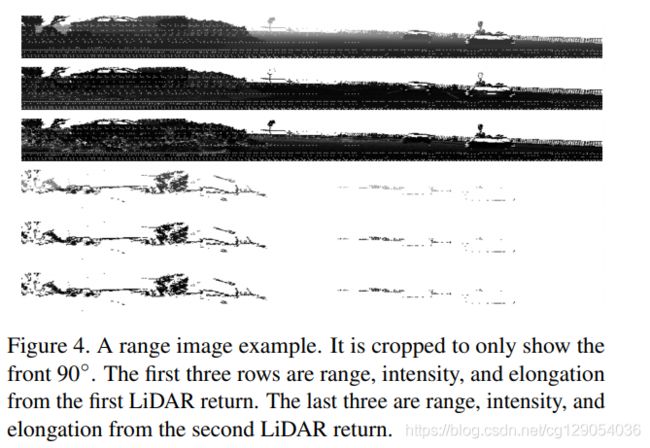
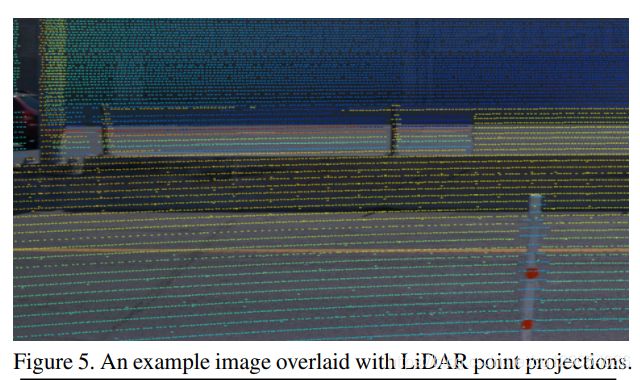
LiDAR 数据在数据集中被编码为距离图像,每个 LiDAR 返回一张; 提供前两次回波的数据。 距离图像格式类似于卷帘快门相机图像,从左到右逐列填充。 每个距离图像像素对应一个 LiDAR 返回波。 高度和宽度由 LiDAR 传感器框架中倾角和方位角的分辨率决定。
此外,对于图像和激光雷达, 投影如下:
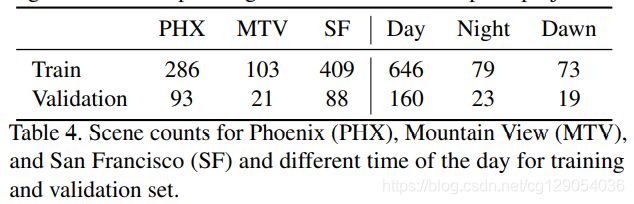
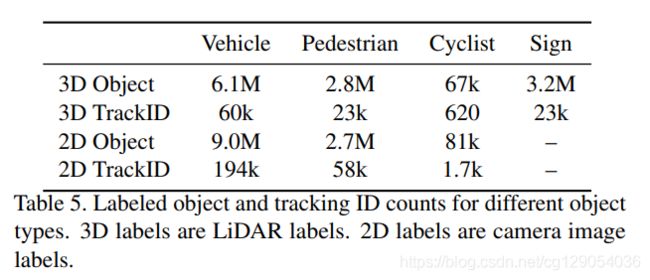
- 5)Dataset Analysis
下面两张表格给出了数据集分布情况,不同城市,不同天气,不同类别目标的统计情况。
 |
 |
1.4 Tasks
数据集任务划分为2D和3D物体检测和追踪任务,训练集场景有798个,验证集场景有202个,测试集场景有150个。
1.5 Experiments
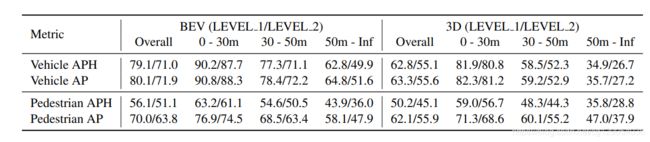
对于3D物体检测,Waymo提供了一个Baseline,其使用的检测方法是PointPillars。对于2D物体检测,使用了Faster R-CNN作为baseline,对于3D物体追踪,使用了AB3DMOT作为Baseline。
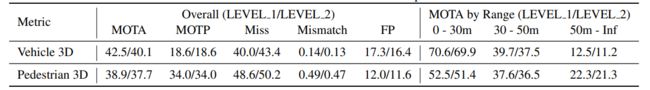
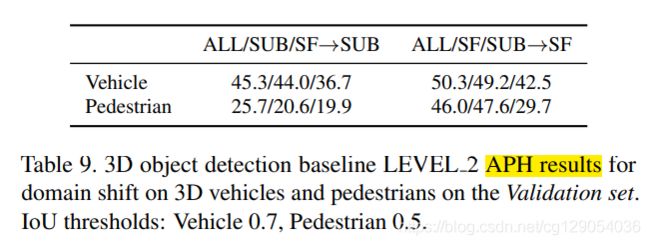
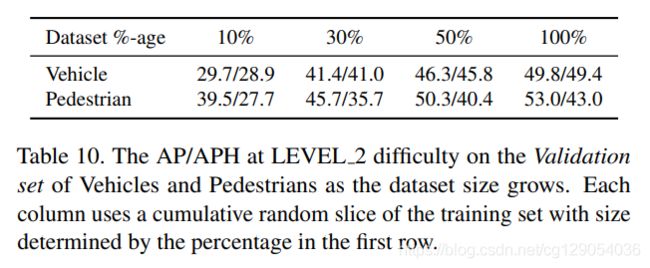
下面几张表格给出了Baseline结果:行人和汽车检测和追踪结果,域适应检测结果,数据集大小对检测结果的影响。
| Baseline APH and AP for vehicles and pedestrians | Baseline multi-object tracking metrics for vehicles and pedestrians | ||
|---|---|---|---|
 |
 |
 |
 |
2. Waymo Open Dataset Tutorial
下面介绍Waymo官放提供的数据使用教程,以下程序是在Colab上运行的。
2.1 Install waymo_open_dataset package
首先是安装数据包:
!rm -rf waymo-od > /dev/null
!git clone https://github.com/waymo-research/waymo-open-dataset.git waymo-od
!cd waymo-od && git branch -a
!cd waymo-od && git checkout remotes/origin/master
!pip3 install --upgrade pip

!pip3 install waymo-open-dataset-tf-2-1-0==1.2.0
然后是导入需要用到的库:
import os
import tensorflow.compat.v1 as tf
import math
import numpy as np
import itertools

tf.enable_eager_execution()

from waymo_open_dataset.utils import range_image_utils
from waymo_open_dataset.utils import transform_utils
from waymo_open_dataset.utils import  frame_utils
from waymo_open_dataset import dataset_pb2 as open_dataset
2.2 Read one frame
数据集中的每一个文件包含帧序列数据,按照时间戳排列,这里提取了两帧来演示:
FILENAME = '/content/waymo-od/tutorial/frames'
dataset = tf.data.TFRecordDataset(FILENAME, compression_type='')
for data in dataset:
	frame = open_dataset.Frame()
	frame.ParseFromString(bytearray(data.numpy()))
	break

(range_images, camera_projections, range_image_top_pose) = frame_utils.parse_range_image_and_camera_projection(frame)
可以查看每一帧包含的信息:
print(frame.context)
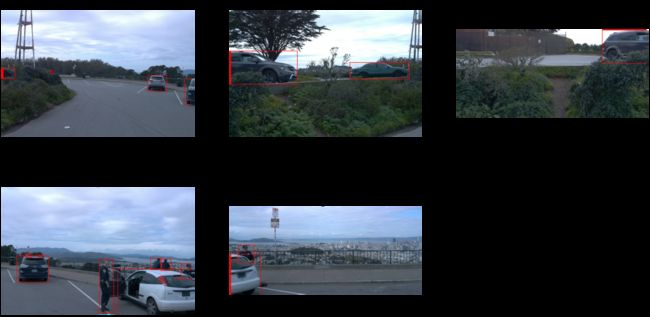
2.3 Visualize Camera Images and Camera Labels
图片数据及其标签可视化:
import matplotlib.pyplot as plt
import matplotlib.patches as patches

def show_camera_image(camera_image, camera_labels, layout, cmap=None):
	 """Show a camera image and the given camera labels."""

	 ax = plt.subplot(*layout)

	 # Draw the camera labels.
	 for camera_labels in frame.camera_labels:
	 	# Ignore camera labels that do not correspond to this camera.
	    if camera_labels.name != camera_image.name:
	    	continue

	    # Iterate over the individual labels.
	    for label in camera_labels.labels:
	    	# Draw the object bounding box.
	     	ax.add_patch(patches.Rectangle(xy=(label.box.center_x - 0.5 * label.box.length,
	           							   label.box.center_y - 0.5 * label.box.width),
	       							       width=label.box.length,
	       								   height=label.box.width,
	       							       linewidth=1,
	       								   edgecolor='red',
	       								   facecolor='none'))

	 # Show the camera image.
	 plt.imshow(tf.image.decode_jpeg(camera_image.image), cmap=cmap)
	 plt.title(open_dataset.CameraName.Name.Name(camera_image.name))
	 plt.grid(False)
	 plt.axis('off')

plt.figure(figsize=(25, 20))

for index, image in enumerate(frame.images):
	show_camera_image(image, frame.camera_labels, [3, 3, index+1])
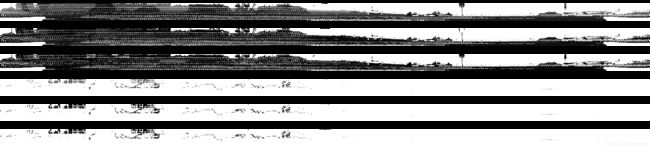
2.4 Visualize Range Images
Range图片可视化:
plt.figure(figsize=(64, 20))
def plot_range_image_helper(data, name, layout, vmin = 0, vmax=1, cmap='gray'):
	"""Plots range image.

	Args:
	  data: range image data
	  name: the image title
	  layout: plt layout
	  vmin: minimum value of the passed data
	  vmax: maximum value of the passed data
	  cmap: color map
	"""
	plt.subplot(*layout)
	plt.imshow(data, cmap=cmap, vmin=vmin, vmax=vmax)
	plt.title(name)
	plt.grid(False)
	plt.axis('off')

def get_range_image(laser_name, return_index):
	"""Returns range image given a laser name and its return index."""
	return range_images[laser_name][return_index]

def show_range_image(range_image, layout_index_start = 1):
	"""Shows range image.

	Args:
	  range_image: the range image data from a given lidar of type MatrixFloat.
	  layout_index_start: layout offset
	"""
	range_image_tensor = tf.convert_to_tensor(range_image.data)
	range_image_tensor = tf.reshape(range_image_tensor, range_image.shape.dims)
	lidar_image_mask = tf.greater_equal(range_image_tensor, 0)
	range_image_tensor = tf.where(lidar_image_mask, range_image_tensor,
	                              tf.ones_like(range_image_tensor) * 1e10)
	range_image_range = range_image_tensor[...,0]
	range_image_intensity = range_image_tensor[...,1]
	range_image_elongation = range_image_tensor[...,2]
	plot_range_image_helper(range_image_range.numpy(), 'range',
	                 [8, 1, layout_index_start], vmax=75, cmap='gray')
	plot_range_image_helper(range_image_intensity.numpy(), 'intensity',
	                 [8, 1, layout_index_start + 1], vmax=1.5, cmap='gray')
	plot_range_image_helper(range_image_elongation.numpy(), 'elongation',
	                 [8, 1, layout_index_start + 2], vmax=1.5, cmap='gray')
frame.lasers.sort(key=lambda laser: laser.name)
show_range_image(get_range_image(open_dataset.LaserName.TOP, 0), 1)
show_range_image(get_range_image(open_dataset.LaserName.TOP, 1), 4)
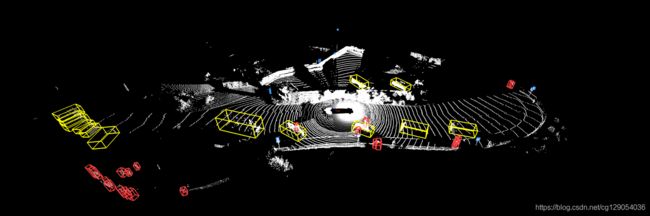
2.5 Point Cloud Conversion and Visualization
点云转换和可视化:
points, cp_points = frame_utils.convert_range_image_to_point_cloud(frame, range_images, camera_projections, range_image_top_pose)
points_ri2, cp_points_ri2 = frame_utils.convert_range_image_to_point_cloud(frame, range_images, camera_projections, range_image_top_pose, ri_index=1)

# 3d points in vehicle frame.
points_all = np.concatenate(points, axis=0)
points_all_ri2 = np.concatenate(points_ri2, axis=0)
# camera projection corresponding to each point.
cp_points_all = np.concatenate(cp_points, axis=0)
cp_points_all_ri2 = np.concatenate(cp_points_ri2, axis=0)

'''
print(points_all.shape)
print(cp_points_all.shape)
print(points_all[0:2])
for i in range(5):
	print(points[i].shape)
	print(cp_points[i].shape)

print(points_all_ri2.shape)
print(cp_points_all_ri2.shape)
print(points_all_ri2[0:2])
for i in range(5):
	print(points_ri2[i].shape)
	print(cp_points_ri2[i].shape)
'''
from IPython.display import Image, display
display(Image('/content/waymo-od/tutorial/3d_point_cloud.png'))
2.6 Visualize Camera Projection
点云数据投影:
images = sorted(frame.images, key=lambda i:i.name)
cp_points_all_concat = np.concatenate([cp_points_all, points_all], axis=-1)
cp_points_all_concat_tensor = tf.constant(cp_points_all_concat)

# The distance between lidar points and vehicle frame origin.
points_all_tensor = tf.norm(points_all, axis=-1, keepdims=True)
cp_points_all_tensor = tf.constant(cp_points_all, dtype=tf.int32)

mask = tf.equal(cp_points_all_tensor[..., 0], images[0].name)

cp_points_all_tensor = tf.cast(tf.gather_nd(
    cp_points_all_tensor, tf.where(mask)), dtype=tf.float32)
points_all_tensor = tf.gather_nd(points_all_tensor, tf.where(mask))

projected_points_all_from_raw_data = tf.concat(
    [cp_points_all_tensor[..., 1:3], points_all_tensor], axis=-1).numpy()

def rgba(r):
	"""Generates a color based on range.

	Args:
	  r: the range value of a given point.
	Returns:
	  The color for a given range
	"""
	c = plt.get_cmap('jet')((r % 20.0) / 20.0)
	c = list(c)
	c[-1] = 0.5  # alpha
	return c

def plot_image(camera_image):
	"""Plot a cmaera image."""
	plt.figure(figsize=(20, 12))
	plt.imshow(tf.image.decode_jpeg(camera_image.image))
	plt.grid("off")

def plot_points_on_image(projected_points, camera_image, rgba_func,
                         point_size=5.0):
	"""Plots points on a camera image.

	Args:
	projected_points: [N, 3] numpy array. The inner dims are
	[camera_x, camera_y, range].
	camera_image: jpeg encoded camera image.
	rgba_func: a function that generates a color from a range value.
	point_size: the point size.

	"""
	plot_image(camera_image)

	xs = []
	ys = []
	colors = []

	for point in projected_points:
	xs.append(point[0])  # width, col
	ys.append(point[1])  # height, row
	colors.append(rgba_func(point[2]))

	plt.scatter(xs, ys, c=colors, s=point_size, edgecolors="none")

plot_points_on_image(projected_points_all_from_raw_data,
                     images[0], rgba, point_size=5.0)