matlab的基本操作
matlab的基本操作
图像的读取与展示
1.imread()
A = imread(filename)
clear all;
A = imread("C:\Users\25023\Desktop\图像识别文件\实验一图像\ngc6543a.jpg");
imshow(A);
whos A;
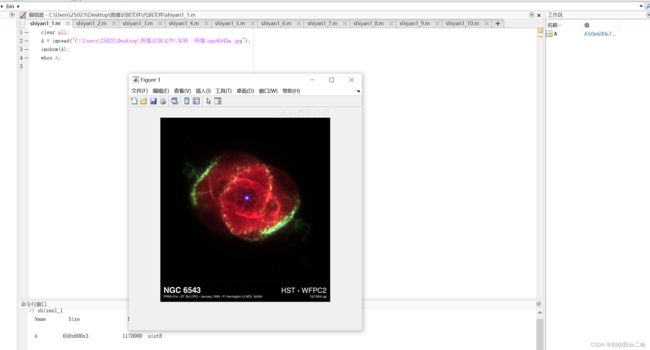
他的意思是在当前路径里把文件名为“ngc6543a.jpg”的图片数据读取到A中保存,那我们可以看到在图片最右边Workspace区域放着一些数据,这就是A的数据,我们看到这张图片是6506003大小,意思是650行,600列,3通道(RGB)的图片,右边的UINT8表示8位无符号的整型类型
2.imshow
inshow(A)就是将该图片显示出来
3.imwrite()
2.imwrite:将图像写入图像文件
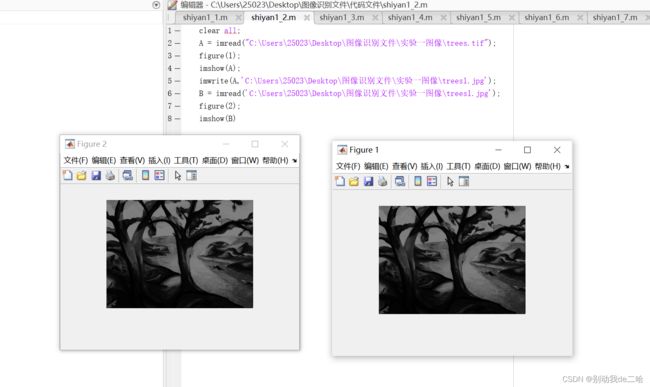
clear all;
A = imread("C:\Users\25023\Desktop\图像识别文件\实验一图像\trees.tif");
figure(1);
imshow(A);
imwrite(A,'C:\Users\25023\Desktop\图像识别文件\实验一图像\trees1.jpg');
B = imread('C:\Users\25023\Desktop\图像识别文件\实验一图像\trees1.jpg');
figure(2);
imshow(B)
语法格式:
(1)imwrite(A,文件名,‘图像文件格式’)
将变量A中的图像按‘图像文件格式’指定的保存格式写入‘文件名’指定的文件中。
(2)imwrite(X,map,文件名,‘图像文件格式’)
将X中的索引图像及其相关的调色板存放到指定文件。
(3)imwrite(…,文件名)
根据文件名的扩展名推断文件格式,将图像写入文件中,扩展名必须是合法的。
3.imfinfo()返回图像文件信息
clear all;
info=imfinfo('C:\Users\25023\Desktop\图像识别文件\实验一图像\trees1.jpg');
info
语法格式:
(1)info=imfinfo(文件名,‘图像文件格式’)
返回一个图像信息结构或结构数组。
(2)info=imfinfo(文件名)
可根据内容推断文件格式
显示的图像文件的信息包括:文件名、文件修改日期、文件大小、图像文件格式、格式版本、图像宽度、图像高度、每个像素位数、颜色信息等。
图像的类型转换
一、真彩色图像转化为灰度图像
Matlab函数:rgb2gray
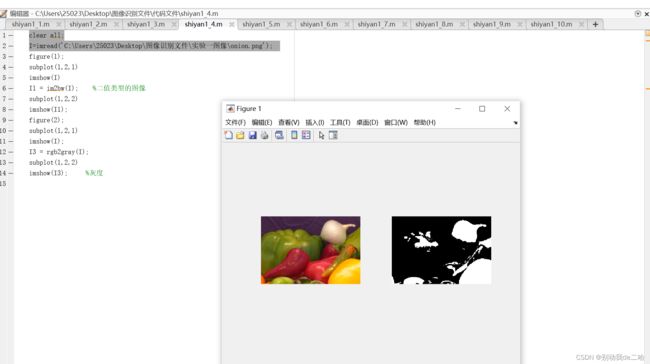
clear all;
I=imread('C:\Users\25023\Desktop\图像识别文件\实验一图像\onion.png');
figure(2);
subplot(1,2,1)
imshow(I);
I3 = rgb2gray(I);
subplot(1,2,2)
imshow(I3);     %灰度
二、真彩色图像转化为索引图像
需要使用到的函数:rgb2ind
由于RGB图像一个像素占用三个字节, 分别存储R、G、B分量的值,而索引图像一个像素占用一个字节。在将灰度图像转换为索引图像时, 是从3个字节映射到一个字节的关系。 通常有以下三种算法:
均匀量化法
最小化方差量化法
均匀量化法
RGB = imread('C:\Users\25023\Desktop\图像识别文件\实验一图像\onion.png');
imshow(RGB)
[X1, map1] = rgb2ind(RGB, 64);   %最小方差量化法
[X2, map2] = rgb2ind(RGB, 0.2);  %均匀量化法
map3 = colorcube(128);
X3 = rgb2ind(RGB, map3);  %逆颜色图量化法
figure;
subplot(131);imshow(X1, map1);
subplot(132);imshow(X2, map2);
subplot(133);imshow(X3, map3);
三、灰度图像转换为索引图像
Matlab函数:rgb2ind
info=imfinfo('C:\Users\25023\Desktop\图像识别文件\实验一图像\trees1.jpg');
info;
I = imread('C:\Users\25023\Desktop\图像识别文件\实验一图像\trees1.jpg');
[X, map] = gray2ind(I, 8);
subplot(121);imshow(I);
subplot(122):imshow(X, map);
四、索引图像转换成灰度图像
Matlab函数:ind2gray
I = imread('火影1.jpg');
[X, map] = rgb2ind(I, 64);
gray = ind2gray(X, map);
figure;
subplot(121)
imshow(X, map);
subplot(122)
imshow(gray);
五、索引图像转RGB图像
Matlab函数:ind2rgb
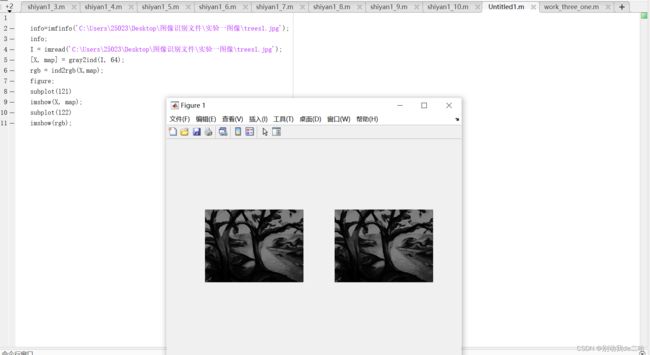
info=imfinfo('C:\Users\25023\Desktop\图像识别文件\实验一图像\trees1.jpg');
info;
I = imread('C:\Users\25023\Desktop\图像识别文件\实验一图像\trees1.jpg');
[X, map] = gray2ind(I, 64);
rgb = ind2rgb(X,map);
figure;
subplot(121)
imshow(X, map);
subplot(122)
imshow(rgb);
六、灰度图转二值图
Matlab函数:im2gray
I = imread('C:\Users\25023\Desktop\图像识别文件\实验一图像\trees1.jpg');
gray = rgb2gray(I);
bw1 = im2bw(gray, 0.4);
bw2 = im2bw(gray, 0.6);
figure;
subplot(131)
imshow(gray);
subplot(132)
imshow(bw1);
subplot(133)
imshow(bw2);
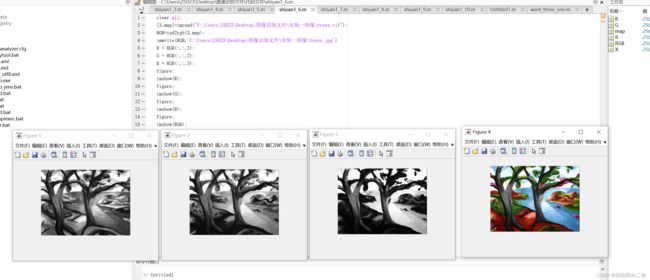
六、显示RGB图像的三色通道:
clear all;
[X,map]=imread("C:\Users\25023\Desktop\图像识别文件\实验一图像\trees.tif");
RGB=ind2rgb(X,map);
imwrite(RGB,'C:\Users\25023\Desktop\图像识别文件\实验一图像\tress.jpg')
R = RGB(:,:,1);
G = RGB(:,:,2);
B = RGB(:,:,3);
figure;
imshow(R);
figure;
imshow(G);
figure;
imshow(B);
figure;
imshow(RGB);
