吴恩达机器学习python实现(6):SVM支持向量机(文末附完整代码)
所有的数据来源:链接:https://pan.baidu.com/s/1vTaw1n77xPPfKk23KEKARA
提取码:5gl2
1 Support Vector Machines
1.1 Prepare datasets
import numpy as np
import pandas as pd
import matplotlib.pyplot as plt
import seaborn as sb    # 更好的可视化封装库
from scipy.io import loadmat
from sklearn import svm

'''
1.Prepare datasets
'''
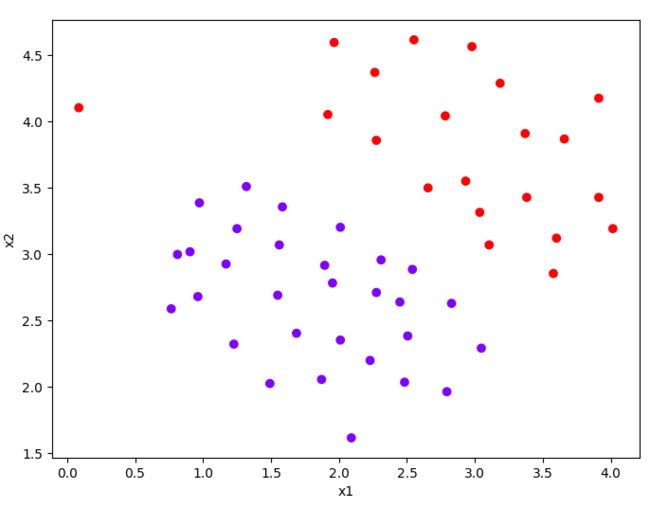
mat = loadmat('data/ex6data1.mat')
print(mat.keys())
# dict_keys(['__header__', '__version__', '__globals__', 'X', 'y'])
X = mat['X']
y = mat['y']
'''大多数SVM的库会自动帮你添加额外的特征x0,所以无需手动添加。'''
def plotData(X, y):
    plt.figure(figsize=(8, 6))
    plt.scatter(X[:, 0], X[:, 1], c=y.flatten(), cmap='rainbow')
    # c=list,设置cmap,根据label不一样,设置不一样的颜色
    # c:色彩或颜色序列   camp:colormap(颜色表)
    plt.xlabel('x1')
    plt.ylabel('x2')
    # plt.legend()
    # plt.grid(True)
    # # plt.show()
    pass


# plotData(X, y)
接下来取一段范围,这段范围是根据已有数据的大小进行细微扩大,并且将其分成500段,通过meshgrid获得网格线,最终利用等高线图画出分界线
1.2 Decision Boundary
def plotBoundary(clf, X):
    '''Plot Decision Boundary'''
    x_min, x_max = X[:, 0].min() * 1.2, X[:, 0].max() * 1.1
    y_min, y_max = X[:, 1].min() * 1.1, X[:, 1].max() * 1.1
    # np.linspace(x_min, x_max, 500).shape---->(500, )  500是样本数
    # xx.shape, yy.shape ---->(500, 500) (500, 500)
    xx, yy = np.meshgrid(np.linspace(x_min, x_max, 500), np.linspace(y_min, y_max, 500))
    Z = clf.predict(np.c_[xx.ravel(), yy.ravel()])
    # model.predict:模型预测 (250000, )
    # ravel()将多维数组转换为一维数组 xx.ravel().shape ----> (250000,1)
    # np.c 中的c是column(列)的缩写,就是按列叠加两个矩阵,就是把两个矩阵左右组合,要求行数相等。
    # np.c_[xx.ravel(), yy.ravel()].shape ----> (250000,2) 就是说建立了250000个样本
    Z = Z.reshape(xx.shape)
    plt.contour(xx, yy, Z)
    # 等高线得作用就是画出分隔得线
    pass
通过调用sklearn中支持向量机的代码,来进行模型的拟合
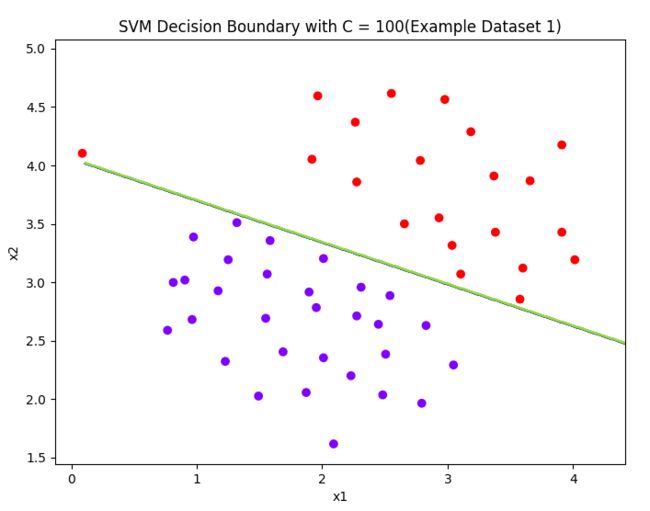
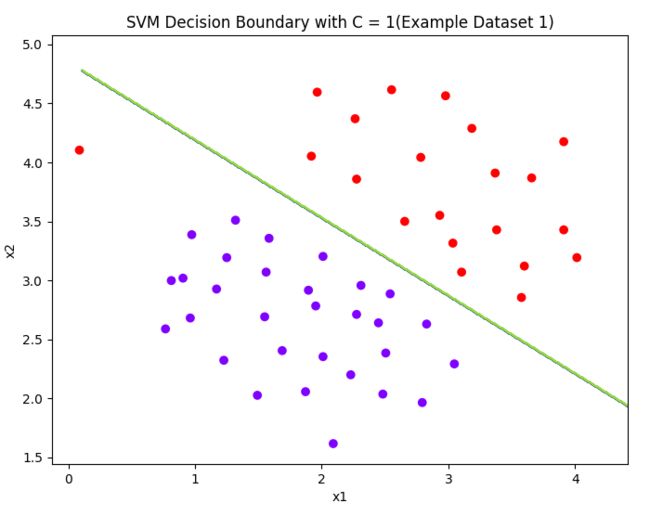
models = [svm.SVC(C, kernel='linear') for C in [1, 100]]
# 支持向量机模型 (kernel:核函数选项,这里是线性核函数 , C:权重,这里取1和100)
# 线性核函数画的决策边界就是直线
clfs = [model.fit(X, y.ravel()) for model in models]    # model.fit:拟合出模型
score = [model.score(X, y) for model in models]        # [0.9803921568627451, 1.0]
# title = ['SVM Decision Boundary with C = {}(Example Dataset 1)'.format(C) for C in [1, 100]]
def plot():
    title = ['SVM Decision Boundary with C = {}(Example Dataset 1)'.format(C) for C in [1, 100]]
    for model, title in zip(clfs, title):
        # zip() 函数用于将可迭代的对象作为参数,将对象中对应的元素打包成一个个元组,然后返回由这些元组组成的列表。
        plt.figure(figsize=(8, 5))
        plotData(X, y)
        plotBoundary(model, X)  # 用拟合好的模型(预测那些250000个样本),绘制决策边界
        plt.title(title)
        pass
    pass
# plt.show()
A large C parameter tells the SVM to try to classify all the examples correctly.
C plays a rolesimilar to λ, where λ is the regularization parameter that we were using previously for logistic regression.
可以理解对误差的惩罚,惩罚大,则曲线分类精准。
1.2 SVM with Gaussian Kernels
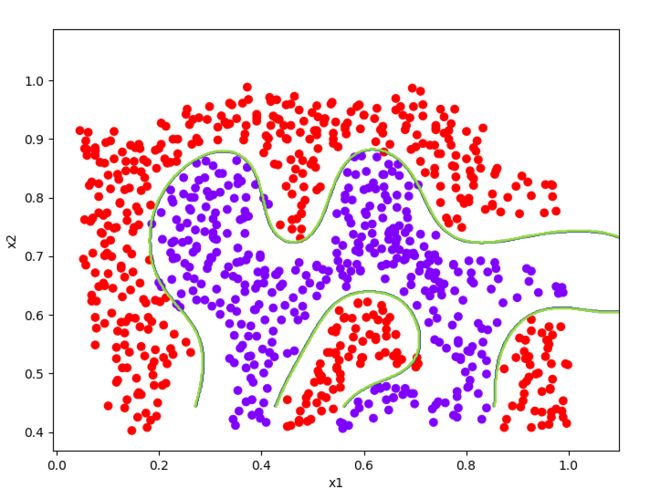
当用SVM作非线性分类时,我们一般使用Gaussian Kernels。
K gaussian ( x ( i ) , x ( j ) ) = exp ( − ∥ x ( i ) − x ( j ) ∥ 2 2 σ 2 ) = exp ( − ∑ k = 1 ( x k ( i ) − x k ( j ) ) 2 2 σ 2 ) K_{\text {gaussian }}\left(x^{(i)}, x^{(j)}\right)=\exp \left(-\frac{\left\|x^{(i)}-x^{(j)}\right\|^{2}}{2 \sigma^{2}}\right)=\exp \left(-\frac{\sum_{k=1}\left(x_{k}^{(i)}-x_{k}^{(j)}\right)^{2}}{2 \sigma^{2}}\right) Kgaussian (x(i),x(j))=exp(−2σ2∥∥x(i)−x(j)∥∥2)=exp⎝⎜⎛−2σ2∑k=1(xk(i)−xk(j))2⎠⎟⎞
本文中使用其自带的即可。
def gaussKernel(x1, x2, sigma):
    return np.exp(-(x1 - x2) ** 2).sum() / (2 * sigma ** 2)


a = gaussKernel(np.array([1, 2, 1]), np.array([0, 4, -1]), 2.)  # 0.32465246735834974
# print(a)
1.2.1 Gaussian Kernel-Example Dataset2
mat = loadmat('data/ex6data2.mat')
x2 = mat['X']
y2 = mat['y']
plotData(x2, y2)
plt.show()
[外链图片转存失败,源站可能有防盗链机制,建议将图片保存下来直接上传(img-ktLdbJ8u-1622612399587)(C:/Users/DELL/AppData/Roaming/Typora/typora-user-images/image-20210601172524887.png)]
sigma = 0.1
gamma = np.power(sigma, -2)/2
'''
高斯核函数中的gamma越大,相当高斯函数中的σ越小,此时的分布曲线也就会越高越瘦。
高斯核函数中的gamma越小,相当高斯函数中的σ越大,此时的分布曲线也就越矮越胖,smoothly,higher bias, lower variance
'''
clf = svm.SVC(C=1, kernel='rbf', gamma=gamma)
model = clf.fit(x2, y2.flatten())       # kernel='rbf'表示支持向量机使用高斯核函数
# https://blog.csdn.net/guanyuqiu/article/details/85109441
# plotData(x2, y2)
# plotBoundary(model, x2)
# plt.show()
1.2.2 Gaussian Kernel-Example Dataset3
'''
Example Dataset3
'''
mat3 = loadmat('data/ex6data3.mat')
x3, y3 = mat3['X'], mat3['y']
Xval, yval = mat3['Xval'], mat3['yval']
plotData(x3, y3)
# plt.show()
Cvalues = (0.01, 0.03, 0.1, 0.3, 1., 3., 10., 30.)  # 权重C的候选值
sigmavalues = Cvalues   # 核函数参数的候选值
best_pair, best_score = (0, 0), 0        # 最佳的(C,sigma)权值 ,决定系数(R2)
# 寻找最佳的权值(C,sigma)
for C in Cvalues:
    for sigma in sigmavalues:
        gamma = np.power(sigma, -2.) / 2
        model = svm.SVC(C=C, kernel='rbf', gamma=gamma)     # 使用核函数的支持向量机
        model.fit(x3, y3.flatten())      # 拟合出模型
        this_score = model.score(Xval, yval)        # 利用交叉验证集来选择最合适的权重
        '''
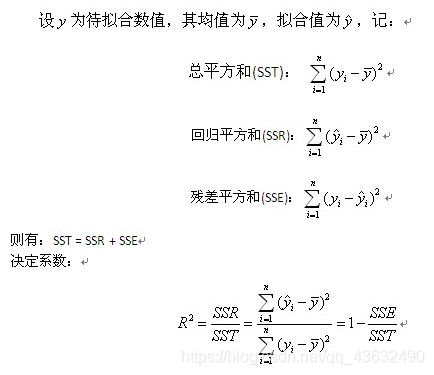
         model.score函数的返回值是决定系数,也称R2。
         可以测度回归直线对样本数据的拟合程度,决定系数的取值在0到1之间,
         决定系数越高,模型的拟合效果越好,即模型解释因变量的能力越强。
         '''
        # 选择拟合得最好得权重值
        if this_score > best_score:
            best_score = this_score
            best_pair = (C, sigma)
        pass
    pass
print('最优(C, sigma)权值:', best_pair, '决定系数:', best_score)
# 最优(C, sigma)权值: (1.0, 0.1) 决定系数: 0.965
model = svm.SVC(1, kernel='rbf', gamma=np.power(0.1, -2.) / 2)
# 用确定好的权重再重新声明一次支持向量机
model.fit(x3, y3.flatten())
plotData(x3, y3)
plotBoundary(model, x3)
# plt.show()
[外链图片转存失败,源站可能有防盗链机制,建议将图片保存下来直接上传(img-zODc0dOu-1622612399590)(C:/Users/DELL/AppData/Roaming/Typora/typora-user-images/image-20210601224239696.png)]
SVM中的score的作用:
2 Spam Classfication
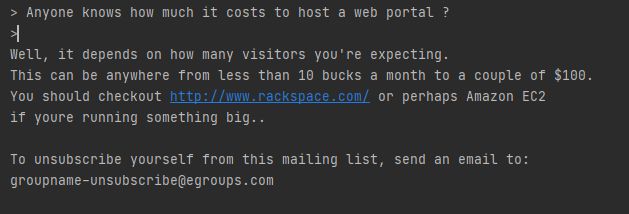
邮件分类这一块就偷一下懒拉,给大家看看代码
import numpy as np
import matplotlib.pyplot as plt
from scipy.io import loadmat
from sklearn import svm
import pandas as pd
import re  # regular expression for e-mail processing

# 这是一个可用的英文分词算法(Porter stemmer)
from stemming.porter2 import stem

# 这个英文算法似乎更符合作业里面所用的代码,与上面效果差不多
import nltk, nltk.stem.porter

with open('data/emailSample1.txt', 'r') as f:
    email = f.read()
    pass
print(email)
#   我们可以做如下处理:
#   1. Lower-casing: 把整封邮件转化为小写。
#   2. Stripping HTML: 移除所有HTML标签,只保留内容。
#   3. Normalizing URLs: 将所有的URL替换为字符串 “httpaddr”.
#   4. Normalizing Email Addresses: 所有的地址替换为 “emailaddr”
#   5. Normalizing Dollars: 所有dollar符号($)替换为“dollar”.
#   6. Normalizing Numbers: 所有数字替换为“number”
#   7. Word Stemming(词干提取): 将所有单词还原为词源。
#   例如,“discount”, “discounts”, “discounted” and “discounting”都替换为“discount”。
#   8. Removal of non-words: 移除所有非文字类型,所有的空格(tabs, newlines, spaces)调整为一个空格.


def processEmail(email):
    '''除了Word Stemming, Removal of non-words之外所有的操作'''
    email = email.lower()
    email = re.sub('<[^<>]>', '', email)    # 匹配<开头,然后所有不是< ,> 的内容,知道>结尾,相当于匹配<...>
    email = re.sub('(http|https)://[^\s]*', 'httpaddr', email)  # 匹配//后面不是空白字符的内容,遇到空白字符则停止
    email = re.sub('[^\s]+@[^\s]+', 'emailaddr', email)
    email = re.sub('[\$]+', 'dollar', email)
    email = re.sub('[\d]+', 'number', email)
    return email


def email2TokenList(email):
    """预处理数据,返回一个干净的单词列表"""

    # I'll use the NLTK stemmer because it more accurately duplicates the
    # performance of the OCTAVE implementation in the assignment
    stemmer = nltk.stem.porter.PorterStemmer()

    email = processEmail(email)

    # 将邮件分割为单个单词,re.split() 可以设置多种分隔符
    tokens = re.split('[ \@\$\/\#\.\-\:\&\*\+\=\[\]\?\!\(\)\{\}\,\'\"\>\_\<\;\%]', email)

    # 遍历每个分割出来的内容
    tokenlist = []
    for token in tokens:
        # 删除任何非字母数字的字符
        token = re.sub('[^a-zA-Z0-9]', '', token)
        # Use the Porter stemmer to 提取词根
        stemmed = stemmer.stem(token)
        # 去除空字符串‘’,里面不含任何字符
        if not len(token):
            continue
        tokenlist.append(stemmed)

    return tokenlist

# 在对邮件进行预处理之后,我们有一个处理后的单词列表。
# 下一步是选择我们想在分类器中使用哪些词,我们需要去除哪些词。
# 我们有一个词汇表vocab.txt,里面存储了在实际中经常使用的单词,共1899个。
# 我们要算出处理后的email中含有多少vocab.txt中的单词,并返回在vocab.txt中的index,
# 这就我们想要的训练单词的索引。


def email2VocanIndices(email, vocab):
    '''提取存在单词的索引'''
    token = email2TokenList(email)
    index = [i for i in range(len(vocab)) if vocab[i] in token]
    return index


def email2FeatureVector(email):
    '''
    将email转化为词向量,n是vocab的长度。存在单词的相应位置的值置为1,其余为0
    :param email:
    :return:
    '''
    df = pd.read_table('data/vocab.txt', names=['words'])
    vocab = np.array(df)    # return array
    vector = np.zeros(len(vocab))   # init vector
    vocab_indices = email2VocanIndices(email, vocab)    # 返回含有单词的索引
    # 将有单词的索引值置为1
    for i in vocab_indices:
        vector[i] = 1
        pass
    return vector


vector = email2FeatureVector(email)
print('length of vector = {}\nnum of non-zero = {}'.format(len(vector), int(vector.sum())))


# Training set
mat1 = loadmat('data/spamTrain.mat')
X, y = mat1['X'], mat1['y']

# Test set
mat2 = loadmat('data/spamTest.mat')
Xtest, ytest = mat2['Xtest'], mat2['ytest']

clf = svm.SVC(C=0.1, kernel='linear')
clf.fit(X, y)


predTrain = clf.score(X, y)
predTest = clf.score(Xtest, ytest)
print(predTrain, predTest)
# 0.99825
附完整代码:
import numpy as np
import pandas as pd
import matplotlib.pyplot as plt
import seaborn as sb    # 更好的可视化封装库
from scipy.io import loadmat
from sklearn import svm

'''
1.Prepare datasets
'''
mat = loadmat('data/ex6data1.mat')
print(mat.keys())
# dict_keys(['__header__', '__version__', '__globals__', 'X', 'y'])
X = mat['X']
y = mat['y']
'''大多数SVM的库会自动帮你添加额外的特征x0,所以无需手动添加。'''


def plotData(X, y):
    plt.figure(figsize=(8, 6))
    plt.scatter(X[:, 0], X[:, 1], c=y.flatten(), cmap='rainbow')
    # c=list,设置cmap,根据label不一样,设置不一样的颜色
    # c:色彩或颜色序列   camp:colormap(颜色表)
    plt.xlabel('x1')
    plt.ylabel('x2')
    # plt.legend()
    # plt.grid(True)
    # # plt.show()
    pass


# plotData(X, y)
def plotBoundary(clf, X):
    '''Plot Decision Boundary'''
    x_min, x_max = X[:, 0].min() * 1.2, X[:, 0].max() * 1.1
    y_min, y_max = X[:, 1].min() * 1.1, X[:, 1].max() * 1.1
    # np.linspace(x_min, x_max, 500).shape---->(500, )  500是样本数
    # xx.shape, yy.shape ---->(500, 500) (500, 500)
    xx, yy = np.meshgrid(np.linspace(x_min, x_max, 500), np.linspace(y_min, y_max, 500))
    Z = clf.predict(np.c_[xx.ravel(), yy.ravel()])
    # model.predict:模型预测 (250000, )
    # ravel()将多维数组转换为一维数组 xx.ravel().shape ----> (250000,1)
    # np.c 中的c是column(列)的缩写,就是按列叠加两个矩阵,就是把两个矩阵左右组合,要求行数相等。
    # np.c_[xx.ravel(), yy.ravel()].shape ----> (250000,2) 就是说建立了250000个样本
    Z = Z.reshape(xx.shape)
    plt.contour(xx, yy, Z)
    # 等高线得作用就是画出分隔得线
    pass


models = [svm.SVC(C, kernel='linear') for C in [1, 100]]
# 支持向量机模型 (kernel:核函数选项,这里是线性核函数 , C:权重,这里取1和100)
# 线性核函数画的决策边界就是直线
clfs = [model.fit(X, y.ravel()) for model in models]    # model.fit:拟合出模型
score = [model.score(X, y) for model in models]        # [0.9803921568627451, 1.0]
# title = ['SVM Decision Boundary with C = {}(Example Dataset 1)'.format(C) for C in [1, 100]]

def plot():
    title = ['SVM Decision Boundary with C = {}(Example Dataset 1)'.format(C) for C in [1, 100]]
    for model, title in zip(clfs, title):
        # zip() 函数用于将可迭代的对象作为参数,将对象中对应的元素打包成一个个元组,然后返回由这些元组组成的列表。
        plt.figure(figsize=(8, 5))
        plotData(X, y)
        plotBoundary(model, X)  # 用拟合好的模型(预测那些250000个样本),绘制决策边界
        plt.title(title)
        pass
    pass

# plt.show()

'''
2.SVM with Gaussian Kernels
'''


def gaussKernel(x1, x2, sigma):
    return np.exp(-(x1 - x2) ** 2).sum() / (2 * sigma ** 2)


a = gaussKernel(np.array([1, 2, 1]), np.array([0, 4, -1]), 2.)  # 0.32465246735834974
# print(a)

'''
Example Dataset 2
'''

mat = loadmat('data/ex6data2.mat')
x2 = mat['X']
y2 = mat['y']
plotData(x2, y2)
plt.show()

sigma = 0.1
gamma = np.power(sigma, -2)/2
'''
高斯核函数中的gamma越大,相当高斯函数中的σ越小,此时的分布曲线也就会越高越瘦。
高斯核函数中的gamma越小,相当高斯函数中的σ越大,此时的分布曲线也就越矮越胖,smoothly,higher bias, lower variance
'''
clf = svm.SVC(C=1, kernel='rbf', gamma=gamma)
model = clf.fit(x2, y2.flatten())       # kernel='rbf'表示支持向量机使用高斯核函数
# https://blog.csdn.net/guanyuqiu/article/details/85109441
# plotData(x2, y2)
# plotBoundary(model, x2)
# plt.show()


'''
Example Dataset3
'''
mat3 = loadmat('data/ex6data3.mat')
x3, y3 = mat3['X'], mat3['y']
Xval, yval = mat3['Xval'], mat3['yval']
plotData(x3, y3)
# plt.show()

Cvalues = (0.01, 0.03, 0.1, 0.3, 1., 3., 10., 30.)  # 权重C的候选值
sigmavalues = Cvalues   # 核函数参数的候选值
best_pair, best_score = (0, 0), 0        # 最佳的(C,sigma)权值 ,决定系数(R2)
# 寻找最佳的权值(C,sigma)
for C in Cvalues:
    for sigma in sigmavalues:
        gamma = np.power(sigma, -2.) / 2
        model = svm.SVC(C=C, kernel='rbf', gamma=gamma)     # 使用核函数的支持向量机
        model.fit(x3, y3.flatten())      # 拟合出模型
        this_score = model.score(Xval, yval)        # 利用交叉验证集来选择最合适的权重
        '''
         model.score函数的返回值是决定系数,也称R2。
         可以测度回归直线对样本数据的拟合程度,决定系数的取值在0到1之间,
         决定系数越高,模型的拟合效果越好,即模型解释因变量的能力越强。
         '''
        # 选择拟合得最好得权重值
        if this_score > best_score:
            best_score = this_score
            best_pair = (C, sigma)
        pass
    pass
print('最优(C, sigma)权值:', best_pair, '决定系数:', best_score)
# 最优(C, sigma)权值: (1.0, 0.1) 决定系数: 0.965
model = svm.SVC(1, kernel='rbf', gamma=np.power(0.1, -2.) / 2)
# 用确定好的权重再重新声明一次支持向量机
model.fit(x3, y3.flatten())
plotData(x3, y3)
plotBoundary(model, x3)
# plt.show()
参考链接:https://blog.csdn.net/Cowry5/article/details/80465922
