泰坦尼克号的数据分析
数据分析之泰坦尼克号事件
本文就泰坦尼克号上的生还率与各个因素之间的关系进行探索。
首先,我们先在网上进行泰坦尼克号数据的下载。
然后引用python中的几个包。
import numpy as np
import pandas as pd
import matplotlib.pyplot as plt
import seaborn as sns
%matplotlib inline`
然后进行文件导入
df = pd.read_csv('TTNKH.csv')
接下来检查一下文件,然后看看数据中有多少幸存者。
df.info()
total_survived_sum = df['Survived'].sum()
total_nosurvived_sum =891 - df['Survived'].sum()
print("幸存者为%d,遇难者为%d"%(total_survived_sum,total_nosurvived_sum))
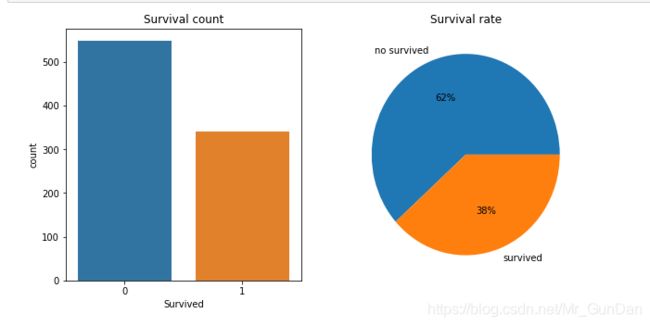
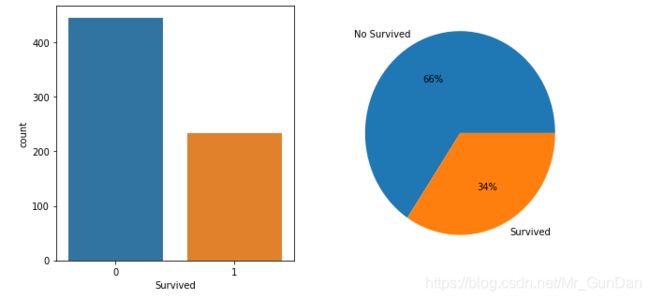
此次数据共有891人,幸存者为342,遇难者为549。
然后可以把生还者与未生还者的数据进行可视化。
plt.figure(figsize=(10,5))
plt.subplot(121)
sns.countplot(x="Survived",data=df )
plt.title('Survival count')

plt.subplot(122)
plt.pie([total_nosurvived_sum,total_survived_sum],labels=['no survived','survived'],autopct='%1.0f%%')
plt.title('Survival rate')

plt.show()
接下来就要对各因素进行具体分析了,首先是船舱等级。
我们先查询一下各船舱分别有多少人。
df[['Pclass','Survived']].groupby(['Pclass']).count()
plt.figure(figsize=(10,5))
plt.subplot(121)
sns.countplot(x='Pclass',data=df)
plt.title('Pclass count')

plt.subplot(122)
plt.pie(df[['Pclass','Survived']].groupby(['Pclass']).count(),labels=['1','2','3'],autopct='%1.0f%%')
plt.show()
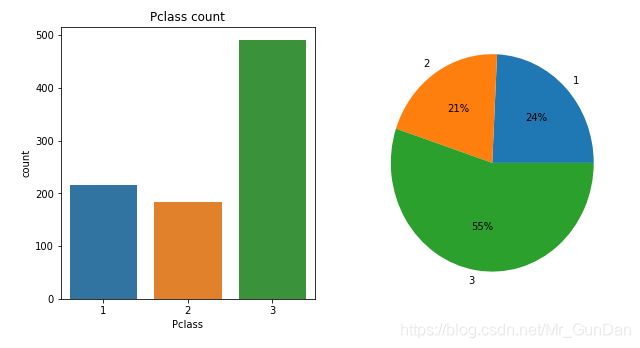
由图可以明显看出,在灾难发生前,一等舱、二等舱、三等舱的乘客分别为216、184、491人,分别占总人数的 24%, 21%, 55%。
然后是灾难发生之后各船舱幸存人数。
survived_df=df[df[ 'Survived'] == 1]
survived_df[['Pclass','Survived']].groupby('Pclass').sum()
plt.figure(figsize=(10,5))
plt.subplot(121)
sns.countplot(x='Pclass',data=survived_df)
plt.title('Pclass Survived')
plt.ylabel('Survived Count')

plt.subplot(122)
plt.pie(survived_df[['Pclass','Survived']].groupby('Pclass').sum(),labels=['1','2','3'],autopct='%1.0f%%')

plt.show()
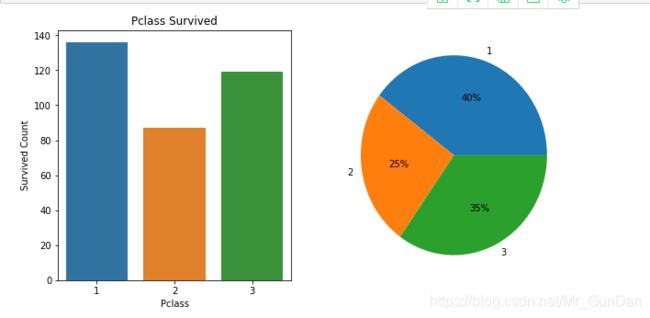
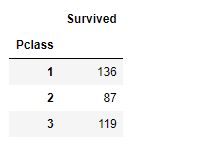
灾难发生后,1等舱的生存人数为136人,2等舱的生存人数为87人,3等舱的生存人数为119人,分别占总生存人数的40%,25%,35%。
接下该对各船舱的生存情况进行一个对比。
Pclass1=df[df['Pclass']==1]
Pclass2=df[df['Pclass']==2]
Pclass3=df[df['Pclass']==3]

plt.figure(figsize=(10,20))
plt.subplot(4,2,1)
sns.countplot(x='Survived',data=Pclass1)
plt.title('Pclass 1')
plt.subplot(4,2,2)
plt.pie([Pclass1['Survived'][Pclass1['Survived'] == 0].count(),Pclass1['Survived'][Pclass1['Survived'] == 1].count()],labels=['No Survived', 'Survived'],autopct='%1.0f%%')

plt.subplot(4,2,3)
sns.countplot(x='Survived',data=Pclass2)
plt.title('Pclass 2')
plt.subplot(4,2,4)
plt.pie([Pclass2['Survived'][Pclass2['Survived'] == 0].count(),Pclass2['Survived'][Pclass2['Survived'] == 1].count()],labels=['No Survived', 'Survived'],autopct='%1.0f%%')

plt.subplot(4,2,5)
sns.countplot(x='Survived',data=Pclass3)
plt.title('Pclass 3')
plt.subplot(4,2,6)
plt.pie([Pclass3['Survived'][Pclass3['Survived'] == 0].count(),Pclass3['Survived'][Pclass3['Survived'] == 1].count()],labels=['No Survived', 'Survived'],autopct='%1.0f%%')

plt.subplot(4,1,4)
df.groupby('Pclass')['Survived'].mean().plot(kind='bar')

plt.show()
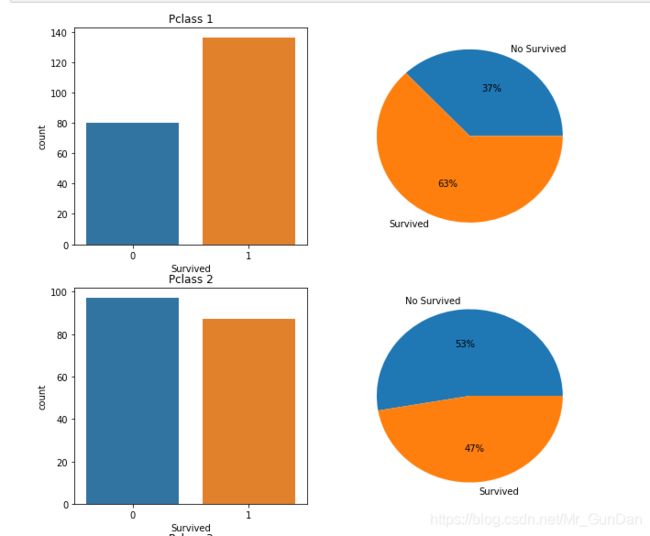
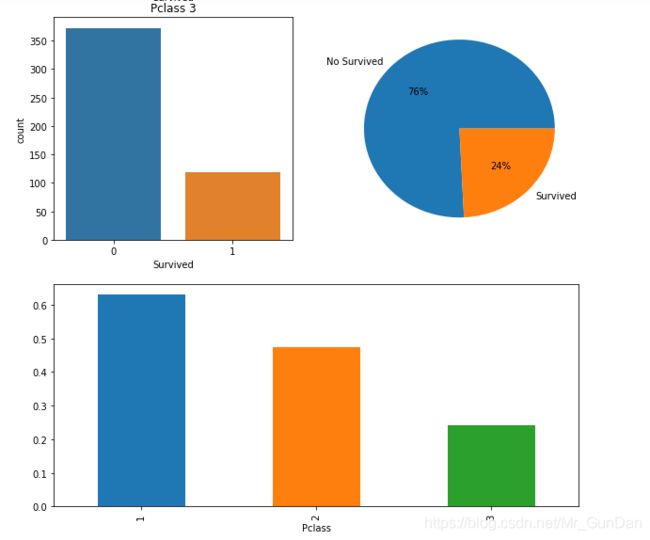
可以看到一等舱生还率为 63%,二等舱为 47%,三等舱为 24%。可见客舱等级越高,生还率越高。
之后该对性别进行分析了。
首先查出船上男女分别为多少。
male=df['Sex'][df['Sex']=='male'].count()
female=df['Sex'][df['Sex']=='female'].count()
print('船上男性为%d人,女性为%d人'%(male,female))
首先查出船上男性为577人,女性为314人。
plt.figure(figsize=(10,5))
plt.subplot(121)
sns.countplot(x='Sex',data=df)

plt.subplot(122)
plt.pie([male,female],labels=['male','female'],autopct='%1.0f%%')
plt.show()
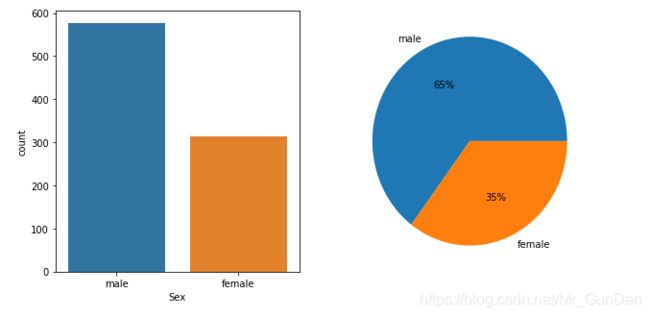
灾难发生前,891人中,男性共577人,女性314人,男女比例为 65% 和 35%
然后进行灾难发生后的人数查询
Survived_male=survived_df['Sex'][survived_df['Sex']=='male'].count()
Survived_female=survived_df['Sex'][survived_df['Sex']=='female'].count()
print('幸存者中男性为%d人,女性为%d人'%(Survived_male, Survived_female))
幸存者中男性为109人,女性为233人
plt.figure(figsize=(10,5))
plt.subplot(121)
sns.countplot(x='Sex', data=survived_df,order=['male','female'])
plt.subplot(122)
plt.pie([Survived_male, Survived_female],labels=['male', 'female'],autopct='%1.0f%%')
plt.show()
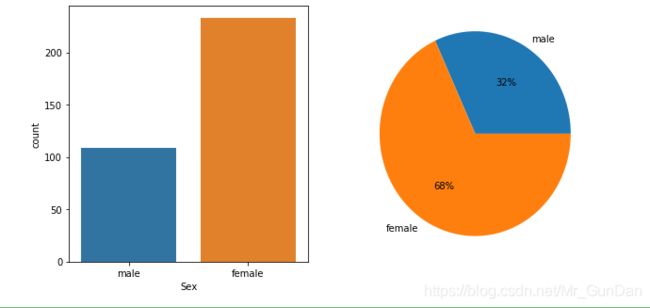
由上图可知灾难发生后,男性变为109人,女性变为233人,男女比例变为 32% 和 68%。
对男性做个分析:
male_df=df[df['Sex']=='male']
male_df['Survived'][male_df['Survived']==1].count()
plt.figure(figsize=(10,5))
plt.subplot(121)
sns.countplot(x='Survived',data=male_df)
plt.subplot(122)
plt.pie([male_df['Survived'][male_df['Survived']==0].count(),male_df['Survived'][male_df['Survived']==1].count()],labels=['no Survived','Survived'],autopct='%1.0f%%')
plt.show()
female_df=df[df['Sex']=='female']
female_df['Survived'][female_df['Survived']==1].count()
plt.figure(figsize=(10,5))
plt.subplot(121)
sns.countplot(x='Survived',data=female_df)
plt.subplot(122)
plt.pie([female_df['Survived'][female_df['Survived']==0].count(),female_df['Survived'][female_df['Survived']==1].count()],labels=['no Survived','Survived'],autopct='%1.0f%%')
plt.show()
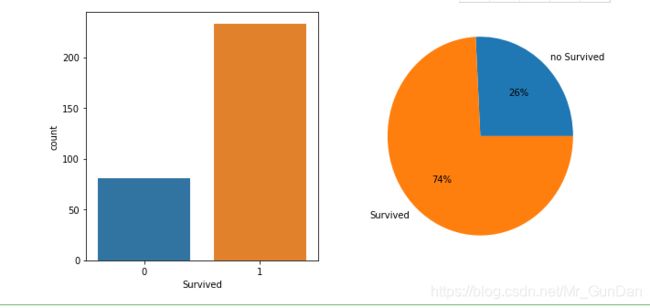
女性生还 233 人,生还率为 74%。
对男女生还率做个汇总:
df.groupby('Sex')['Survived'].mean()
df.groupby('Sex')['Survived'].mean().plot(kind='bar')
plt.show()
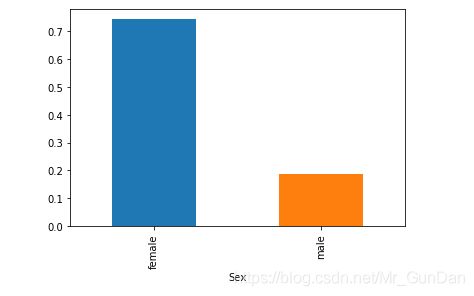
可以观察到女性生还率明显高于男性。
然后是对年龄因素的分析。
由于数据不完整,需要对个别缺失年龄的数据进行填充。
average_age=df['Age'].mean()
std_age=df['Age'].std()
count_nan_age=df['Age'].isnull().sum()
rand1=np.random.randint(average_age-std_age,average_age+std_age,size=count_nan_age)
df['Age'][np.isnan(df['Age'])]=rand1
plt.figure(figsize=(12,5))
plt.subplot(121)
df['Age'].hist(bins=70)
plt.xlabel('Age')
plt.ylabel('Num')

plt.subplot(122)
df.boxplot(column='Age',showfliers=False)
plt.show()
df['Age'].describe()
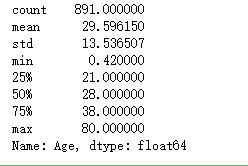
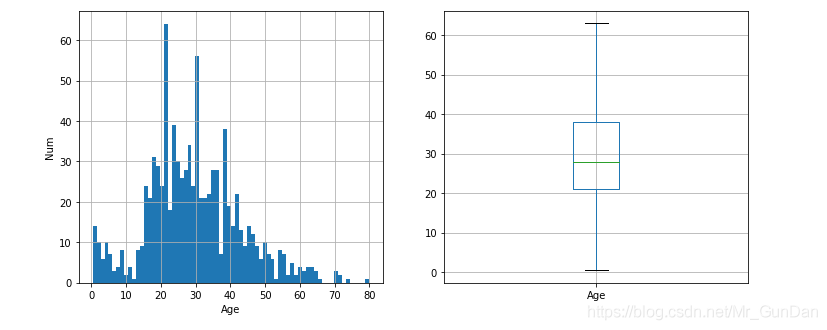
可以看出在891 人中,平均年龄约为 30 岁, 标准差 14 岁,最小年龄为 0.42岁 ,最大年龄 80岁。
然后按年龄将船上的人划分为四类:
children_df=df[df['Age']<=12]
juvenile_df = df[(df['Age'] > 12) & (df['Age'] < 18)]
adults_df=df[(df['Age']>=18)&(df['Age']<65)]
agedness_df=df[df['Age']>=65]
首先查出四类人群的生还情况和生存率:
children_survived_sum = children_df['Survived'].sum()
juvenile_survived_sum = juvenile_df['Survived'].sum()
adults_survived_sum = adults_df['Survived'].sum()
agedness_survived_sum = agedness_df['Survived'].sum()
print('儿童生还人数为%d人,少年生还人数为%d人,成年人生还人数为%d人,老年人生还人数为%d人'%(children_survived_sum, juvenile_survived_sum, adults_survived_sum , agedness_survived_sum))
儿童生还人数为40人,少年生还人数为26人,成年人生还人数为275人,老年人生还人数为1人。
children_survived_rate = children_df["Survived"].mean()
juvenile_survived_rate = juvenile_df['Survived'].mean()
adults_survived_rate = adults_df['Survived'].mean()
agedness_survived_rate = agedness_df['Survived'].mean()
print('儿童生还率为%f,少年生还率为%f,成年人生还率为%f,老年人生还率为%f'%(children_survived_rate, juvenile_survived_rate, adults_survived_rate, agedness_survived_rate))
儿童生还率为0.579710,少年生还率为0.419355,成年人生还率为0.367156,老年人生还率为0.090909。
将数据进行可视化:
x = ['children', 'juvenile', 'adults', 'agedness']
b = [40, 26, 275, 1]
y = [children_survived_rate, juvenile_survived_rate , adults_survived_rate, agedness_survived_rate]
plt.figure(figsize=(12,5))
plt.subplot(121)
x_pos = list(range(len(x)))
rects = plt.bar(x_pos, b, align='center', alpha=0.5)
def autolabel(rects): #显示数据的高度
    for ii,rect in enumerate(rects):
        height = rect.get_height()
        plt.text(rect.get_x()+rect.get_width()/2., 1.02*height, '%s'% (b[ii]),
            ha='center', va='bottom')
autolabel(rects)
plt.ylabel('Survival num')
plt.xticks(x_pos, x)

plt.subplot(122)
x_pos = list(range(len(x)))
rects = plt.bar(x_pos, y, align='center', alpha=0.5)
def autolabel(rects):
    for ii,rect in enumerate(rects):
        height = rect.get_height()
        plt.text(rect.get_x()+rect.get_width()/2., 1.02*height, '%s'% (y[ii]),
            ha='center', va='bottom')
autolabel(rects)
plt.ylabel('Survival rate')
plt.xticks(x_pos, x)

plt.show()
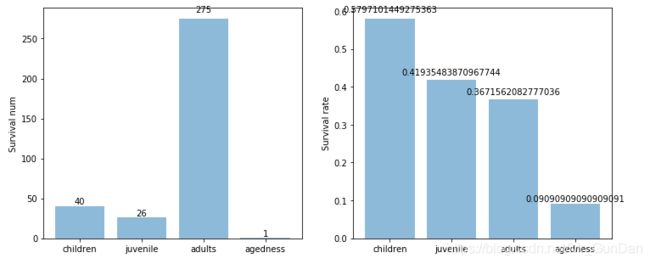
数据中生还的儿童、少年、成年和老年人数分别为40、 21、 228 和 1人,生还率分别为 58%, 48%, 39% 和 9%。
最后我们进行父母因素的分析。
parch_df=df[df['Parch']!=0]
no_parch_df=df[df['Parch']==0]
先对有父母的人员进行分析:
plt.figure(figsize=(10,5))
plt.subplot(121)
sns.countplot(x = 'Survived', data = parch_df )

plt.subplot(122)
plt.pie([parch_df['Survived'][parch_df['Survived'] == 0].count(),parch_df['Survived'][parch_df['Survived'] == 1].count()],labels=['No Survived', 'Survived'],autopct='%1.0f%%')
plt.show()
parch_survived_rate = parch_df["Survived"].mean()
print('有父母的人中生还者为%d人,生还率为%f'%(parch_df['Survived'].sum(),parch_survived_rate))
有父母的人中生还者为109人,生还率为0.511737。
再对没父母的人进行分析:
plt.figure(figsize=(10,5))
plt.subplot(121)
sns.countplot(x = 'Survived', data = no_parch_df)

plt.subplot(122)
plt.pie([no_parch_df['Survived'][no_parch_df['Survived'] == 0].count(),no_parch_df['Survived'][no_parch_df['Survived'] ==1].count()],labels=['No Survived', 'Survived'],autopct='%1.0f%%')
plt.show()
no_parch_survived_rate = no_parch_df["Survived"].mean()
print('没有父母的人中生还者为%d人,生还率为%f'%(no_parch_df['Survived'].sum(),no_parch_survived_rate))
没有父母的人中生还者为233人,生还率为0.343658。
至此本次分析按照船舱等级,性别,年龄,有无父母分别进行对比,观察这些因素是否影响泰坦尼克号上的生存率。
本次数据分析的登船者共有 891人,遇难后,生还者仅剩 342 人,生还率为 38%。
泰坦尼克号上共有三种类型的船舱。遇难前,1等舱里共有 216 人,2等舱有 184 人,3等舱有 491 人。遇难后,三个船舱的乘客人数锐减到136、87、119人。 三个船舱的生还率分别为 63%, 47%和 24%。由数据可知船舱等级越高,生还率越高。
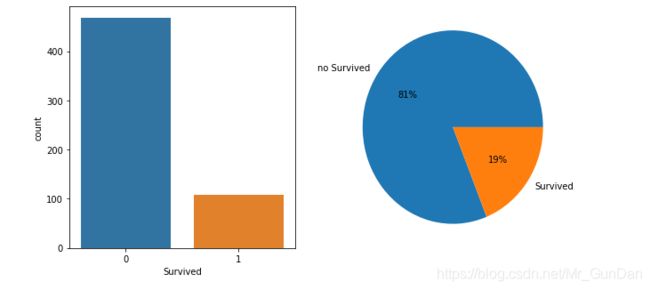
登船时,有 577人为男性, 314人为女性,然后男女比例为 65% 和 35%。 遇难后,男性减少到 109人,女性减少到 233人,男女比例变为 32% 和 68%。男性共有109人生还,生还率为 19%。 女性共有 233 人生还,生还率为 74%。女性比男性更易存活。
泰坦尼克号上的 891 人中,平均年龄约为 30 岁。将所有人员按照儿童、青年、成年、老年划分为四种,这四个类别人的生还率分别为 58%, 48%, 39% 和 9%。 由数据可以看到年龄越小,生还率越高。
此次灾难中,与父母一同登船的乘客,生还人数为 109 人,生还率为 51%。没有与父母一起登船的乘客,生还人数为 233 人,生还率仅为 34%。 由此可见与父母一起登船的乘客生还率高于没有与父母一起登船的乘客。
